S&P 500 COT & Institutional Positioning — Smart Money Analysis
S&P 500 institutional positioning: COT data, sentiment analysis and smart money flow assessment.

Smart Money Positioning
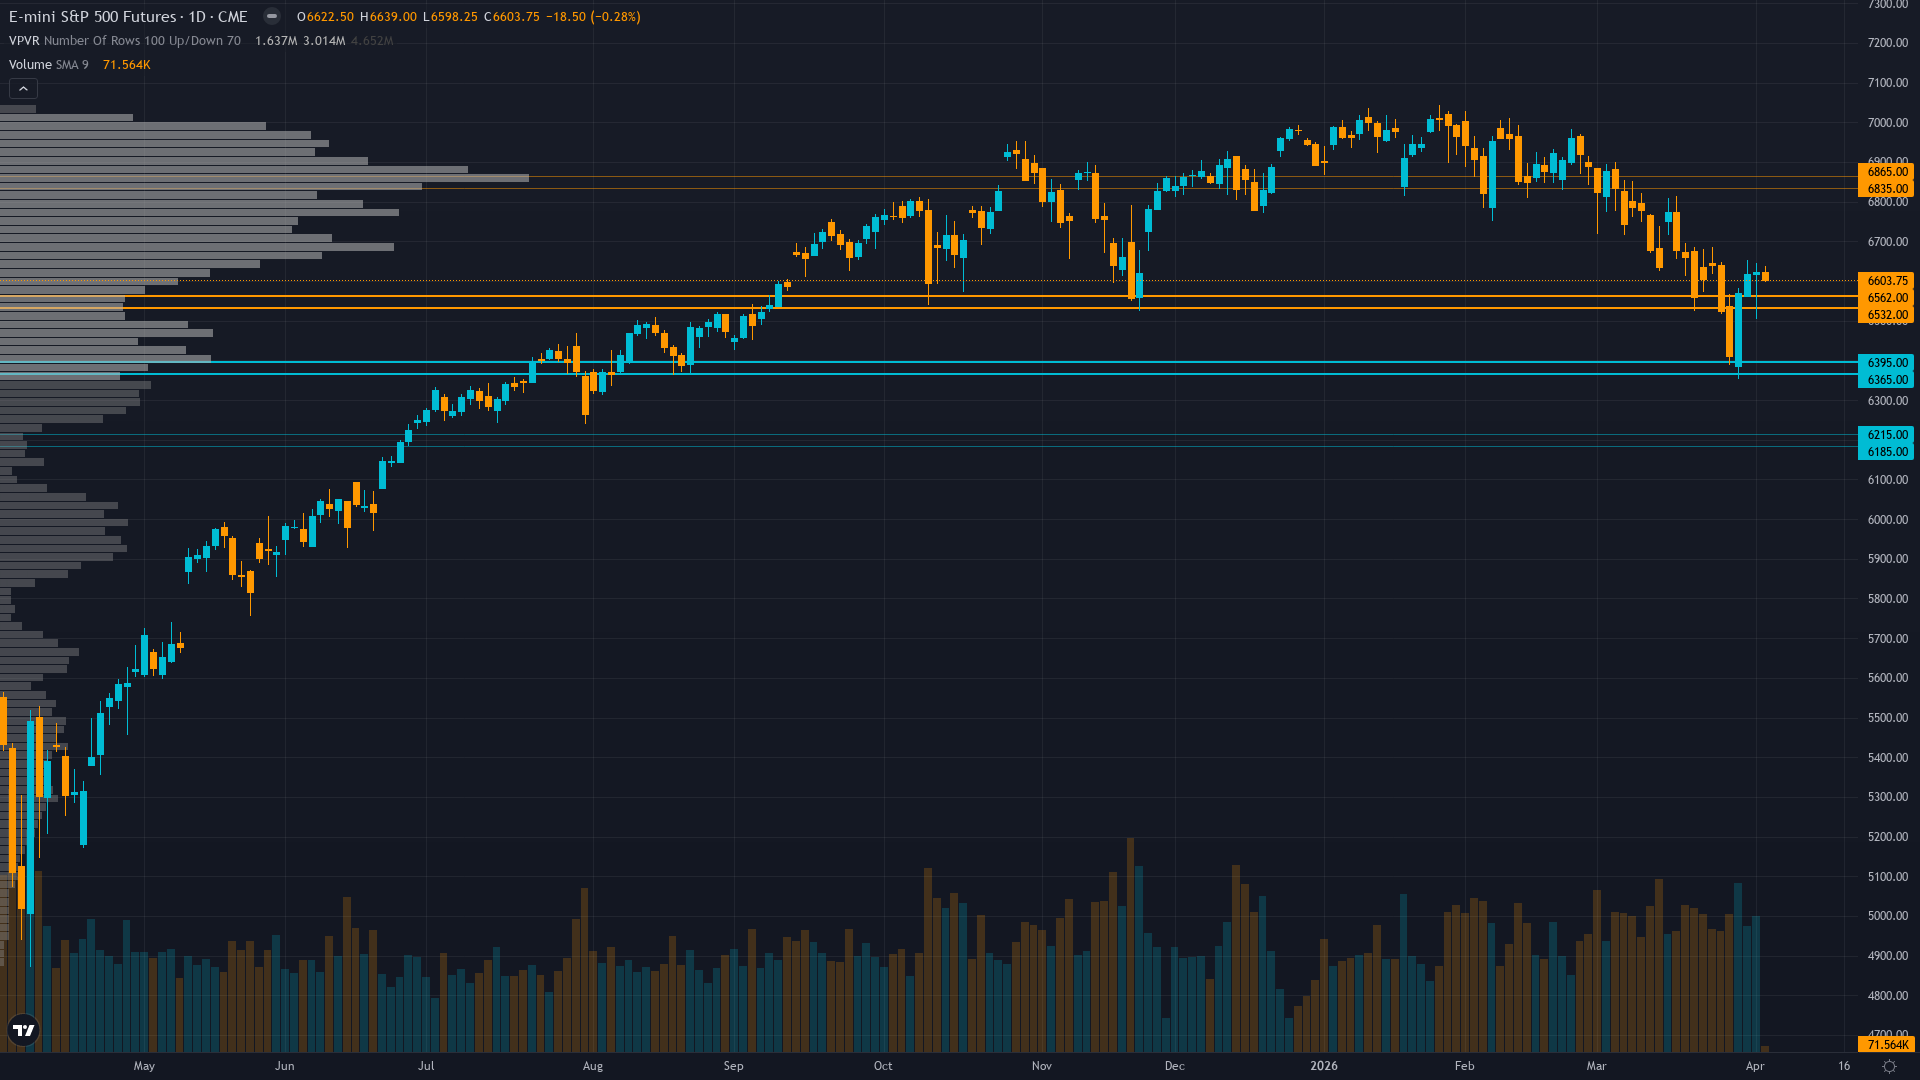
At 6603.75, S&P 500 has eased 0.25% in a controlled retreat.
Cautious after $5.7B ETF outflows on April 3 but relief rally suggests short covering - stale March 3 COT data limits positioning visibility as quarter opened with defensive flows reversing
Consensus Check
Market consensus: Divided between relief rally continuation toward 6746-6850 and consolidation/reversal risk given unrepaired technical breakdown and elevated valuations awaiting earnings validation
Primary driver: Violent sentiment mean-reversion rally from March extreme fear levels - S&P 500 snapped 5-week losing streak with 3.4% weekly gain as VIX compressed from 31.05 to 23.87 and Iran conflict fears subsided
Divergence Assessment
Desk sees March extreme fear as genuine washout enabling sustained recovery toward 6746-6850 while market remains cautious with defensive positioning and elevated hedging despite 3.4% relief rally, creating mild divergence on recovery conviction though consensus itself is divided
Market Sentiment
The sentiment picture for S&P 500 futures is evenly split, providing no contrarian signal in either direction. The next move will likely be event-driven.
What Options Markets Show
VIX compressed sharply from 31.05 to 23.87 (down 23% from peak) showing fear subsiding rapidly, equity put/call 0.59 bullish bias confirms reversal momentum but still elevated versus January compression
Positioning Summary
Putting the positioning picture together for SPX futures: sentiment is fear, trend strength at 5/10 paints a picture of a market with some direction but lacking strong conviction. The net assessment from institutional data, crowd positioning, and derivatives activity points to a market where the balance of forces tilts in a discernible direction.
This analysis covers one dimension. Our full weekly report combines six specialist agents into a single actionable briefing with directional bias, key levels, and risk-opportunity matrix.
Start Free — Get the Market of the WeekFree weekly report · No credit card · Upgrade anytime


