S&P 500 COT & Institutional Positioning — Smart Money Analysis
S&P 500 institutional positioning: COT data, sentiment analysis and smart money flow assessment.

Where Institutions Stand
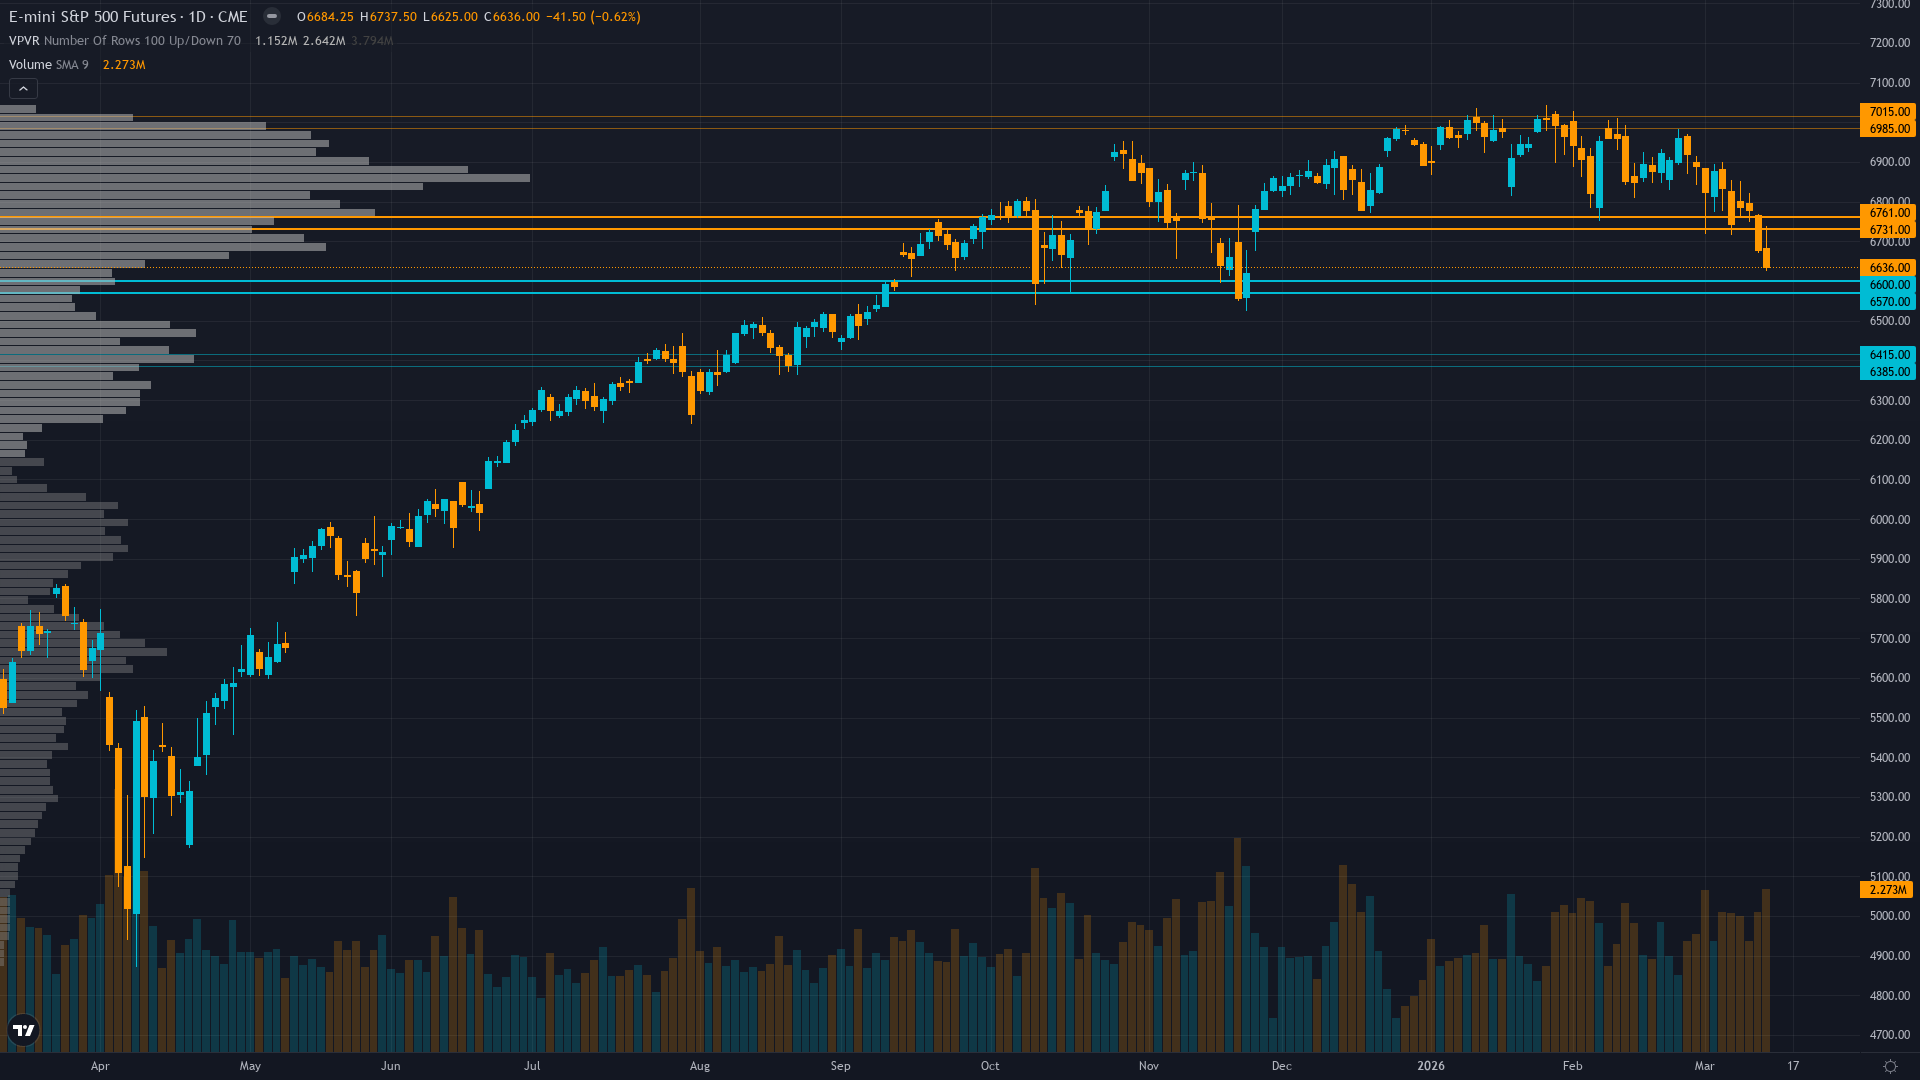
S&P 500 sits at 6636 after slipping 0.62% — a shallow pullback rather than a decisive move.
Defensive deleveraging with quarter-end 16 days away creating window-dressing pressure as VIX expansion triggers systematic volatility-targeting fund reductions despite strong Q1 ETF inflows
Consensus vs MAD View
Market consensus: Divided between extreme fear capitulation suggesting oversold bounce and technical breakdown continuation, majority positioning defensively into March 18-19 FOMC with elevated hedging despite contrarian sentiment signals
Primary driver: VIX explosion to 27.18 representing 52% weekly surge from 19.28 creates extreme fear regime overwhelming technical structure as ES breaks critical 6791 support and tests 6650-6720 symmetry targets
Where the Crowd May Be Wrong
Desk sees extreme sentiment convergence (VIX 27.18, Fear & Greed 21.2, AAII -14.5% spread) as contrarian reversal setup within 3-7 days while market consensus positioning defensively into FOMC expecting continuation of breakdown, creating meaningful divergence on timing and mean-reversion probability that crowd underweights
Crowd Psychology
Neither side has committed heavily to S&P 500 futures, leaving sentiment in a neutral zone that offers little directional guidance on its own.
Options Flow
VIX 27.18 elevated well above 25 fear threshold with SPX put/call 1.16 showing defensive index hedging while equity put/call 0.68 suggests mixed signals, IV regime shift from compressed to elevated creates asymmetric expansion risk
The Bottom Line on Positioning
The positioning mosaic for S&P index combines extreme fear sentiment with expanding volatility conditions. Trend strength is low at 3/10, indicating weak directional conviction and potential for range-bound behaviour. Taken together, institutional behaviour, crowd psychology, and derivatives data frame the setup heading into the new week.
This analysis covers one dimension. Our full weekly report combines six specialist agents into a single actionable briefing with directional bias, key levels, and risk-opportunity matrix.
Start Free — Get the Market of the WeekFree weekly report · No credit card · Upgrade anytime


