Soybeans Key Levels This Week — Support, Resistance & Confluence Zones
Soybeans key levels breakdown: support zones, resistance zones, confluence and price structure.

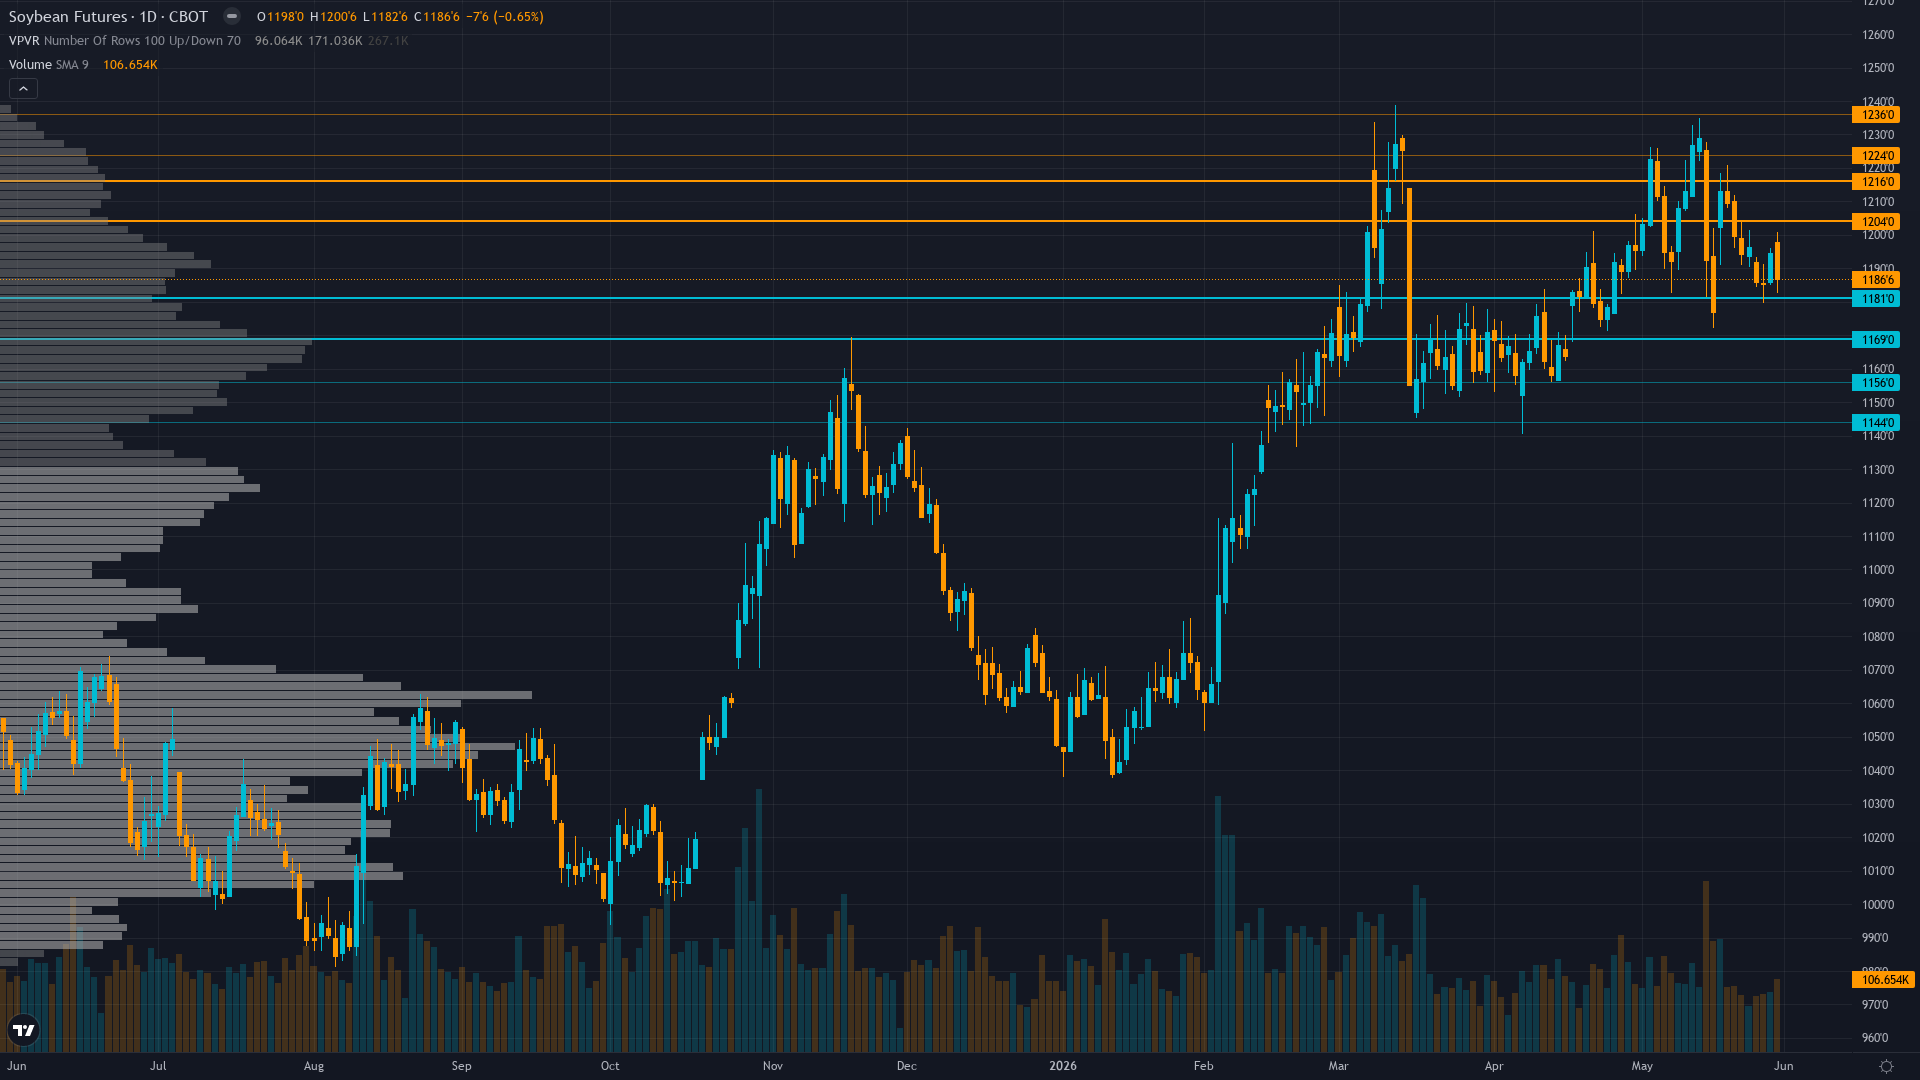
Where Price Sits
soybeans sits at 1186.75 after slipping 0.65% — a shallow pullback rather than a decisive move. soybean futures is in a consolidating after rejection from highs market state, requiring careful assessment of current conditions.
Consolidating at 1187 cents after rejecting 1230 two-year high on May 13, price below 50-day moving average testing 200-day MA support at 1175-1180 with momentum weakening but holding above major 1150 support
Trend strength at 4/10 paints a picture of a market with some direction but lacking strong conviction.
Floors & Demand Zones
soybean price has identifiable support zones below current price where buying interest has historically emerged. These zones represent areas where institutional participants have previously defended price, creating potential floors for pullbacks.
How effectively these zones hold depends on the prevailing regime and whether the volume profile confirms institutional participation.
Resistance Architecture
Above current price, ZS futures encounters structural resistance defined by prior supply zones and profit-taking clusters. These barriers must be overcome convincingly for the upside thesis to develop.
The reliability of resistance depends on the number of touches and the volume traded at each level.
Multi-Agent Confluence
What separates high-probability levels from noise is multi-discipline agreement. The key zones for soybean price are those where technical structure aligns with institutional positioning and options market activity.
Current normal volatility at 58th percentile suggests 12-20 cent daily ranges versus typical 15-20 cent agricultural baseline, consolidation patterns likely with false breakouts common requiring patience for directional conviction, standard stop placement appropriate at 20-25 cents for positioning with June 11 WASDE binary risk warranting wider 30-35 cent stops for event exposure
The Intelligence Behind the Levels
Our multi-agent system analyses key levels from six perspectives simultaneously: technical structure identifies the zones, institutional positioning reveals where smart money is engaged, options flow shows where hedging clusters, fundamentals assess whether levels align with fair value, sentiment measures crowd positioning around levels, and economic data flags catalysts that could trigger level tests.
The result is a set of levels that reflect genuine multi-agent consensus, not the output of a single indicator or a retail trader drawing trendlines.
Our paid reports include specific support and resistance levels identified by six specialist agents — technical structure, institutional positioning, options flow, fundamentals, sentiment, and economic analysis. Not just lines on a chart, but zones validated by multi-discipline confluence.
Start Free — Get the Market of the WeekFree weekly report · No credit card · Upgrade anytime


