Soybeans Key Levels This Week — Support, Resistance & Confluence Zones
Soybeans key levels breakdown: support zones, resistance zones, confluence and price structure.

Price Architecture
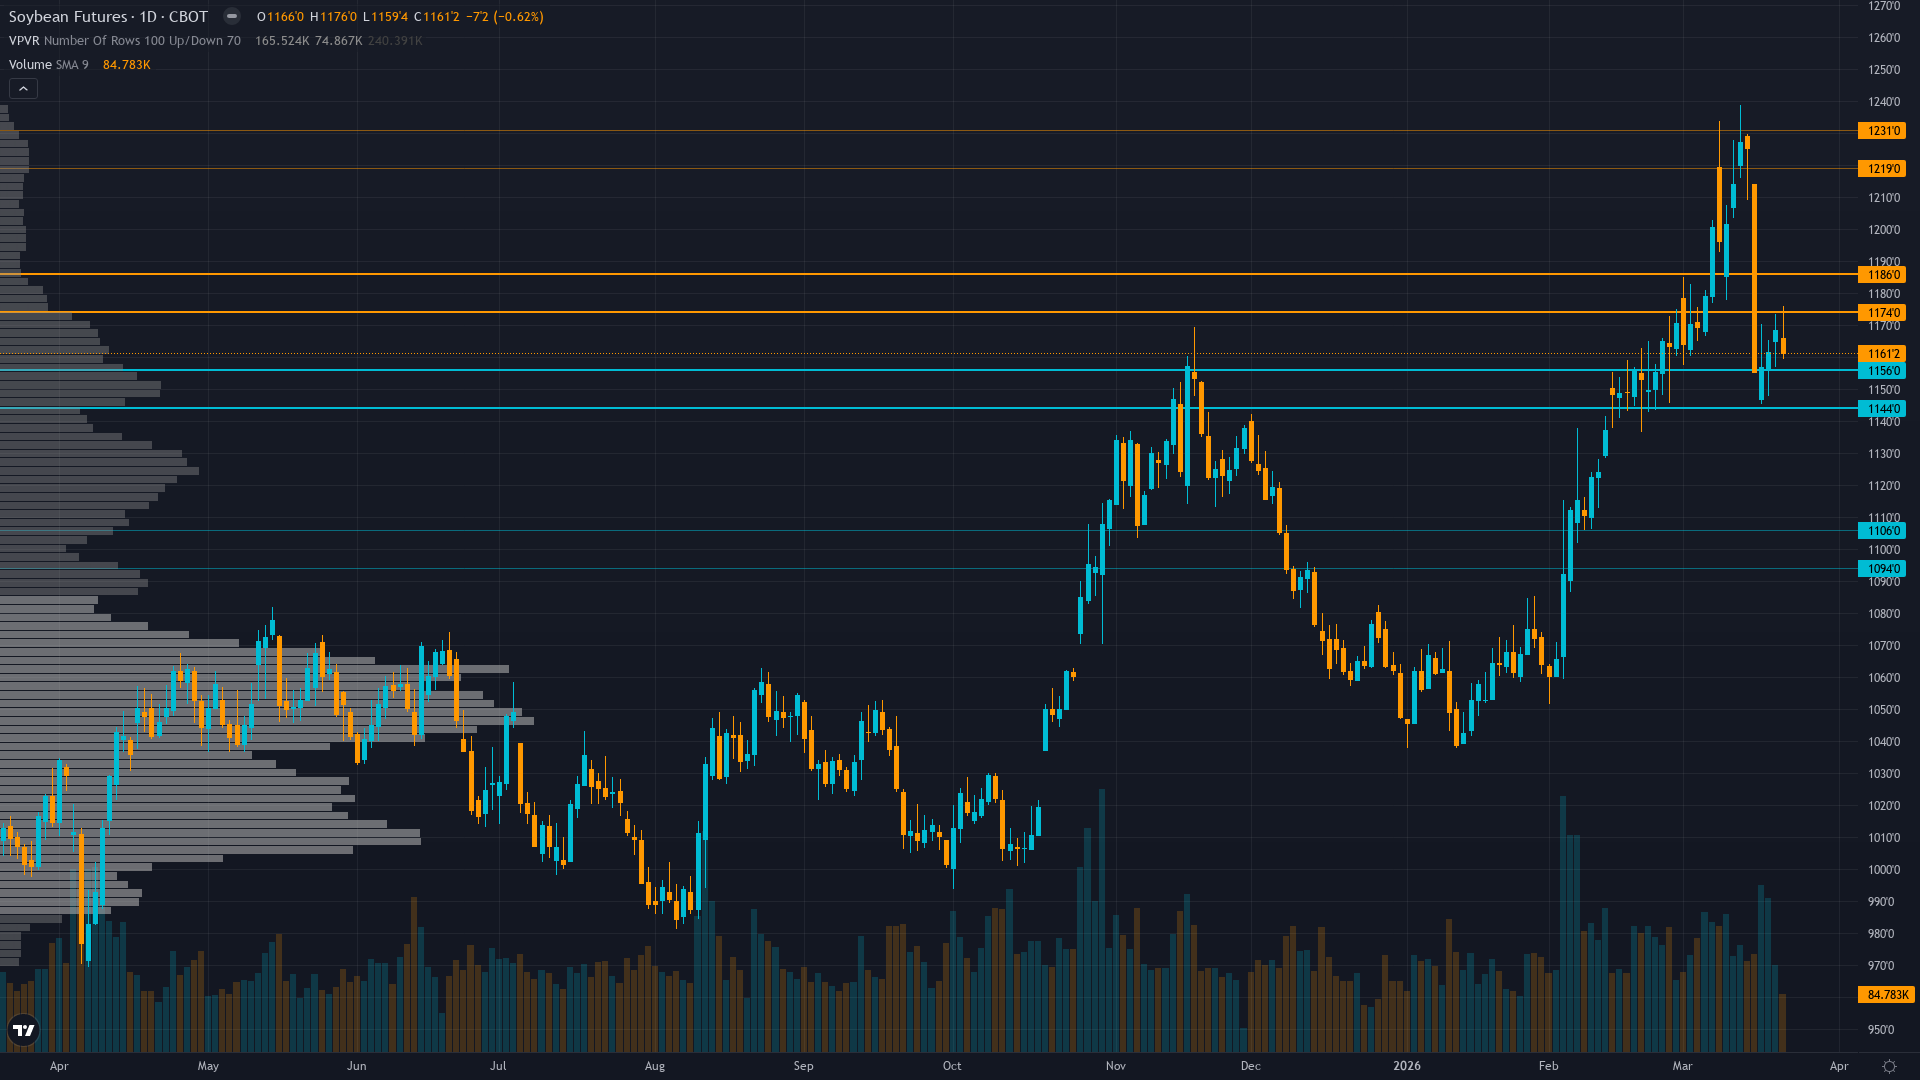
Trading at 1168.5 with a 0.30% dip, soybeans is giving back ground gradually. soybean futures is in a consolidating after breakdown market state, requiring careful assessment of current conditions.
Consolidating 1156-1173 range mid-52-week span after breakdown from March highs, no clear directional bias with sideways trend structure
Trend strength is low at 3/10, indicating weak directional conviction and potential for range-bound behaviour.
Downside Protection
The downside architecture for ZS futures features support zones rooted in prior buying activity. These are not arbitrary lines but areas where real capital has previously been committed.
The reliability of support under post-breakdown consolidation testing whether renewable diesel structural bid supports current levels conditions is shaped by the interplay between volatility regime and historical volume at each level.
Resistance Zone Context
The upside path for soybean price is marked by resistance zones where prior selling activity created structural barriers. Clearing these zones requires either strong momentum or a shift in the fundamental picture.
In the current market state, resistance zones remain key decision points.
Analytical Convergence
The most actionable levels for soybeans are those where multiple analytical disciplines converge. When technical structure, institutional positioning, and options flow all point to the same zone, the probability of price reacting there increases meaningfully.
Current normal volatility suggests 20-30 cent daily ranges versus typical 15-20 cent agricultural baseline, consolidation patterns likely with false breakouts requiring patience for directional conviction
Our Multi-Agent Approach to Key Levels
The levels in our paid reports are generated by six specialist agents working in parallel. Technical analysis provides the structural framework, institutional data shows where capital is committed, options flow reveals hedging behaviour, fundamentals anchor levels to value, sentiment gauges crowd positioning, and economic analysis times the catalysts.
The output is a curated set of levels with institutional-grade validation — the kind of multi-dimensional analysis that hedge fund research desks produce, delivered at a fraction of the cost.
Our paid reports include specific support and resistance levels identified by six specialist agents — technical structure, institutional positioning, options flow, fundamentals, sentiment, and economic analysis. Not just lines on a chart, but zones validated by multi-discipline confluence.
Start Free — Get the Market of the WeekFree weekly report · No credit card · Upgrade anytime


