Soybeans Key Levels This Week — Support, Resistance & Confluence Zones
Soybeans key levels breakdown: support zones, resistance zones, confluence and price structure.

Structural Assessment
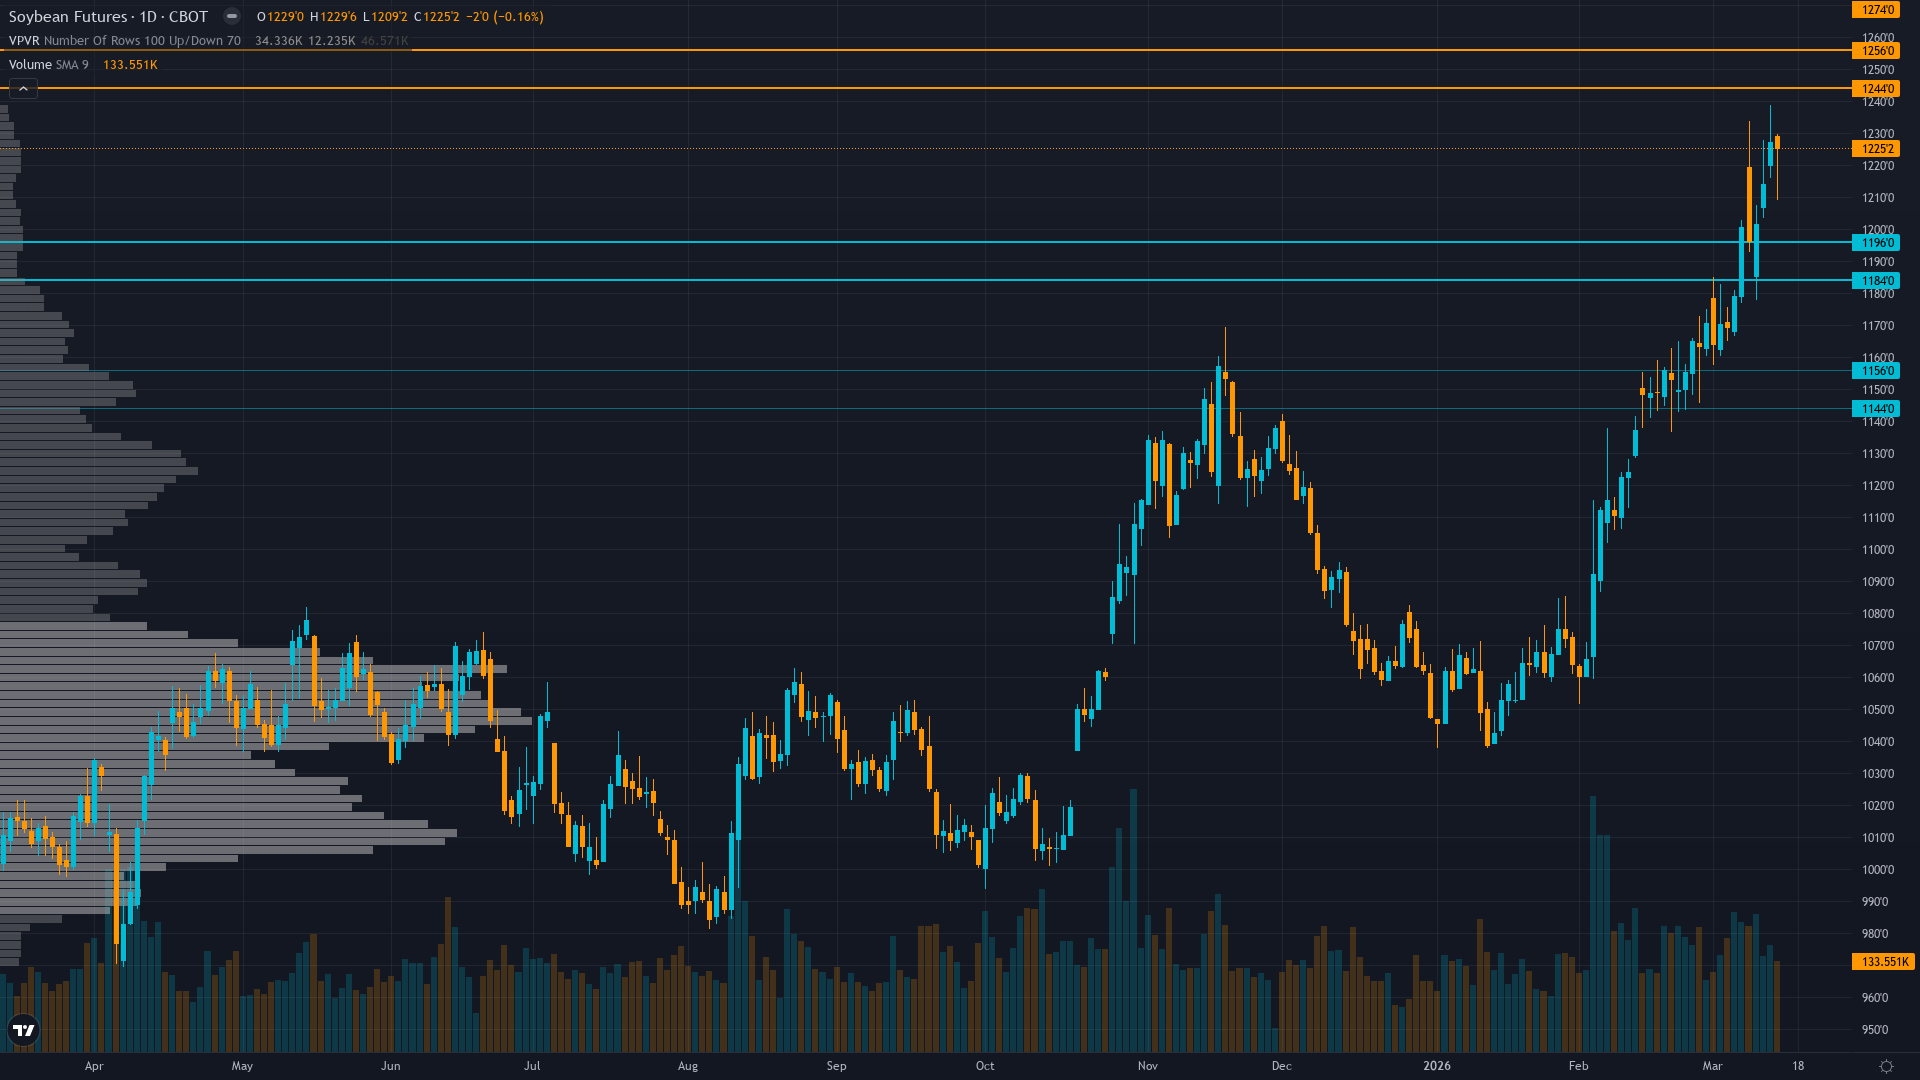
Trading at 1225 with a 0.16% dip, soybeans is giving back ground gradually. soybean futures is consolidating, with price compressing into a narrower range as the market builds energy for its next move.
Uptrend intact at 1225 cents, 20% above 52-week low, testing resistance at 1250 with strong buy signals but approaching overbought levels near March highs
At 5/10, trend strength is middling — enough to suggest a lean, but not enough to trade with high confidence.
Support Architecture
Support levels for soybeans are defined by zones of prior institutional demand. The depth and frequency of prior tests at these levels determines their likely strength.
The strength of support depends on the current ranging regime and volume profile at each level.
Upside Barriers
Resistance levels above CBOT soybeans current price represent zones of historical supply. The significance of each level scales with the number of prior tests and the volume traded there.
The current consolidating regime influences how aggressively these resistance zones are likely to be tested and whether they hold or fold.
Confluence & Methodology
Confluence is the differentiator between a line on a chart and a level worth trading. For soybean futures, the zones with the highest conviction are those validated across technical, institutional, and derivatives dimensions simultaneously.
Current normal volatility suggests 15-20 cent daily ranges versus typical agricultural baseline, consolidation patterns likely with false breakouts requiring patience for directional conviction, standard stop placement appropriate
Beyond Lines on a Chart
Our approach to key levels is designed to filter noise from signal. Six independent agents each assess the same price zones from different perspectives. A level confirmed by one discipline is interesting. A level confirmed by four or five is worth building a trade plan around.
This multi-discipline approach means the levels in our paid reports carry institutional-grade confluence — not just lines on a chart, but zones validated across every analytical dimension that matters.
Our paid reports include specific support and resistance levels identified by six specialist agents — technical structure, institutional positioning, options flow, fundamentals, sentiment, and economic analysis. Not just lines on a chart, but zones validated by multi-discipline confluence.
Start Free — Get the Market of the WeekFree weekly report · No credit card · Upgrade anytime


