Soybeans Forecast This Week — Outlook, Drivers & Key Levels
This week's Soybeans outlook: key drivers, volatility context, risk-opportunity assessment and the week ahead.

Market Overview
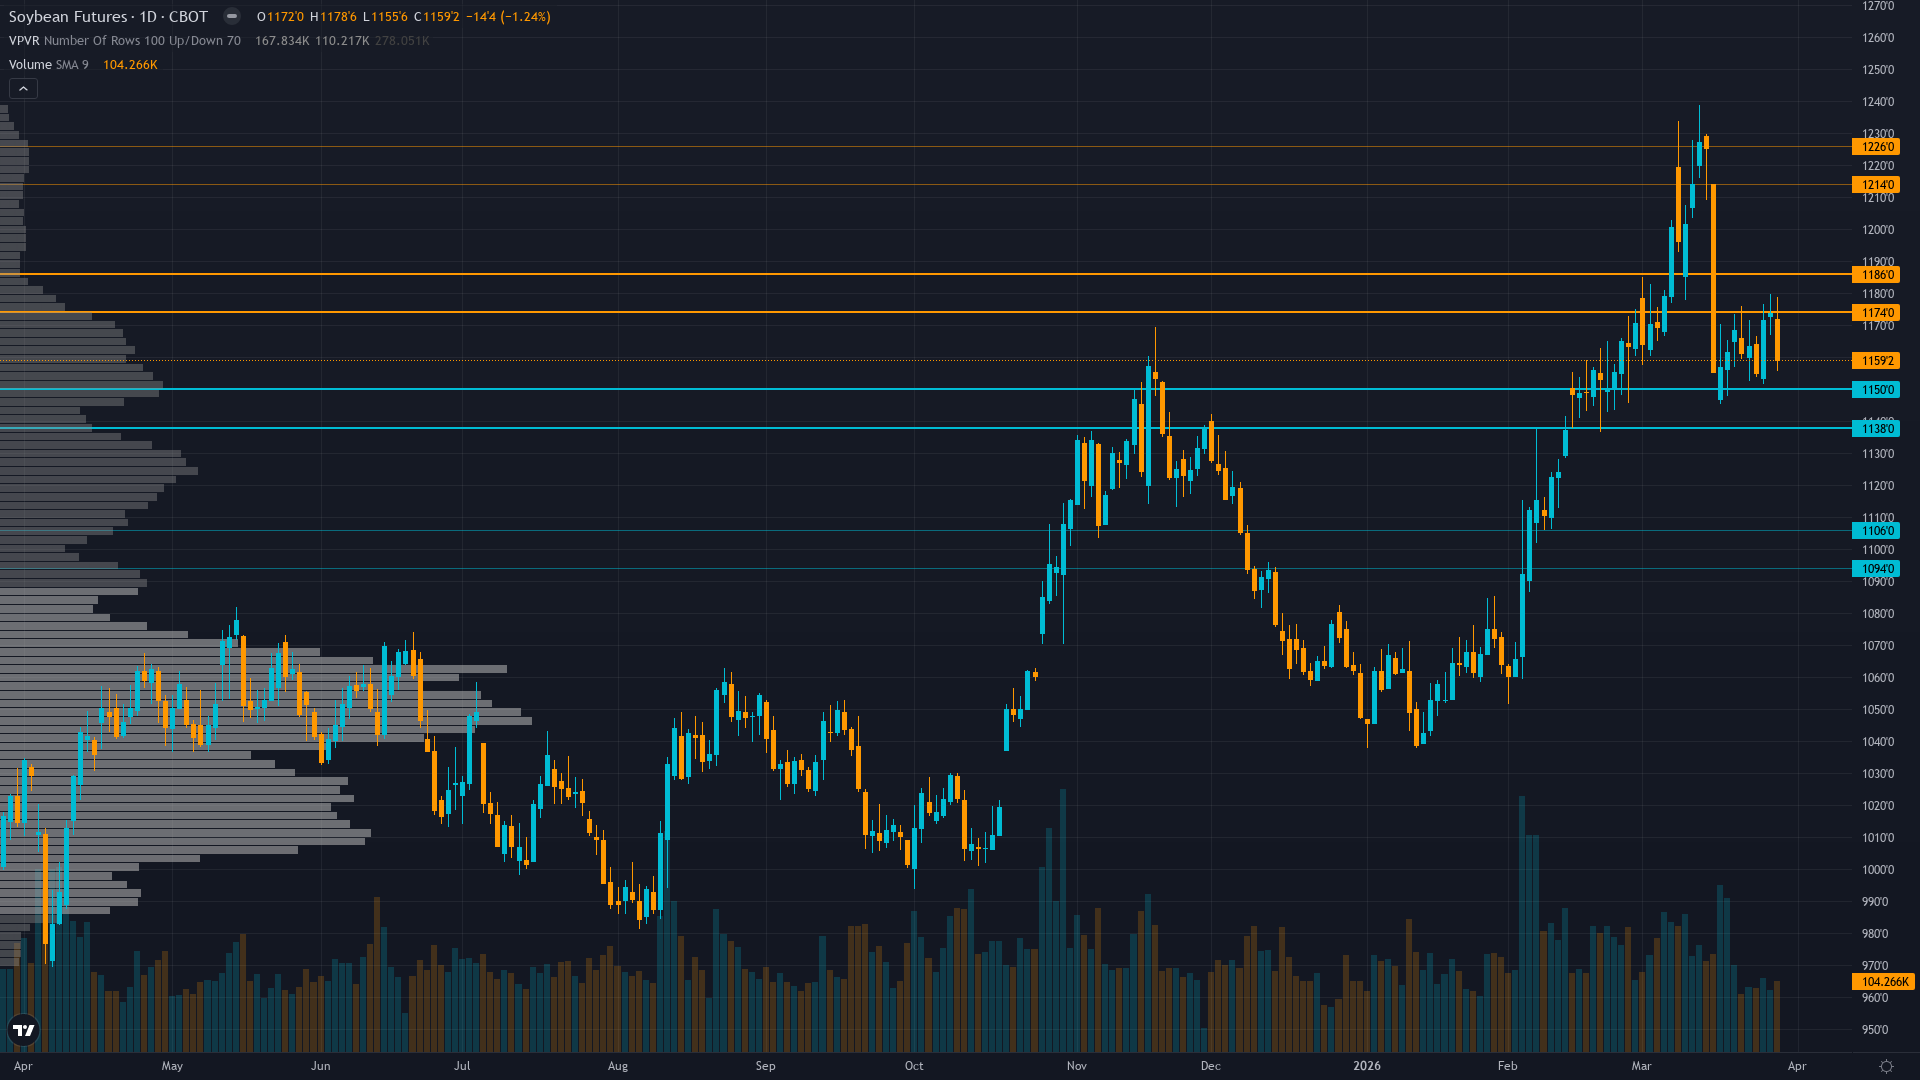
Trading at 1159.5 after a 1.15% slide, soybeans faces sustained selling interest. soybean futures is in a consolidating with breakdown pressure market state, requiring careful assessment of current conditions.
Mixed with bearish fundamental analysts citing WASDE supply increases and Brazilian pricing advantages offset by bullish institutional trend-followers maintaining net long positioning ahead of March 31 binary event creating two-way uncertainty
This Week's Catalysts & Drivers
Primary driver: March 31 USDA Prospective Plantings report 2 days away creates binary event risk with early expectations suggesting potential soybean acreage expansion of 4 million acres to 85 million total pressuring prices alongside continued China purchase uncertainty
Secondary factor: Fundamental analyst signals -2.0 citing WASDE raised US supply by 5M bushels while Brazilian soybeans trade $0.80-$1.00 below US creating 8-10% persistent export competitiveness headwinds overwhelming structural renewable diesel support
Additional influence: Institutional positioning shows managed money reducing net longs by 20,110 contracts to 202,000 (week ending March 17) representing profit-taking ahead of March 31 planting report creating near-term downside momentum
Economic backdrop: USD strength at DXY 100.21 creating export headwinds while VIX elevated at 31.05 signals broader risk-off environment, EPA renewable diesel mandates at 5.61B gallons supporting structural domestic crush demand of 2.56-2.795B bushels
Fundamental assessment: Slightly overvalued at $10.50/bushel with WASDE raising US supply 5M bushels, record Brazilian production at 165+ MMT, and Argentina 48.5 MMT creating comfortable-to-adequate global stocks pressuring valuations despite tight US ending stocks at 350M bushels
Technical Picture
Consolidating at 1159.5 after breaking down from 1173-1238 March rally with momentum deteriorating below moving averages testing 1144 support zone
At 4/10, trend strength is middling — enough to suggest a lean, but not enough to trade with high confidence.
Bull & Bear Case
Primary risk: March 31 Prospective Plantings report shows higher-than-expected soybean acreage intentions above 85 million acres combined with Grain Stocks report revealing larger-than-expected March 1 inventories triggering accelerated long liquidation from current 202,000 contract positioning forcing prices toward 1100-1120 support representing 5-8% downside (Probability: medium)
Primary opportunity: South American late March-April weather disruption during critical reproductive phase or Prospective Plantings showing lower acreage intentions combined with smaller March 1 stocks triggering short-covering rally toward 1200-1220 resistance representing 3-5% upside (Timeframe: Next 2-4 weeks through March 31 USDA binary event and April 10 WASDE updating South American harvest progress during critical yield development window)
This week's edge: Market may be underestimating magnitude of March 31 Prospective Plantings report binary risk with consensus focused on acreage expansion bearish narrative while underweighting potential for supportive surprise showing lower intentions or tighter March 1 stocks creating short-covering opportunity, also potentially underweighting resilience of renewable diesel structural floor at 2.8B bushels that has fundamentally altered US demand structure making export competitiveness less critical than historical relationships suggest
Volatility Regime
Volatility for soybean price is at the 66th percentile over 90 days — a normal regime that allows for standard position sizing and conventional trade management. The vol trend is down, with contraction across timeframes creating the kind of coiled conditions that historically resolve explosively.
Current normal volatility suggests 20-30 cent daily ranges versus typical 15-20 cent agricultural baseline, consolidation patterns producing false breakouts requiring patience for directional conviction, binary March 31 event will compress time premium creating whipsaw risk requiring wider stops of 30-40 cents for positioning versus normal 20-25 cents
What to Watch
The USDA Prospective Plantings Report plus quarterly Grain Stocks report providing first official 2026 acreage intentions and March 1 inventory data on Tuesday 31 March stands as the week's primary risk event — high-impact and capable of overriding the existing technical and sentiment setup.
The interplay between consolidating with breakdown pressure market conditions and upcoming catalysts will define this week's trading landscape for CBOT soybeans.
This analysis covers one dimension. Our full weekly report combines six specialist agents into a single actionable briefing with directional bias, key levels, and risk-opportunity matrix.
Start Free — Get the Market of the WeekFree weekly report · No credit card · Upgrade anytime


