Soybeans COT & Institutional Positioning — Smart Money Analysis
Soybeans institutional positioning: COT data, sentiment analysis and smart money flow assessment.

Institutional Positioning
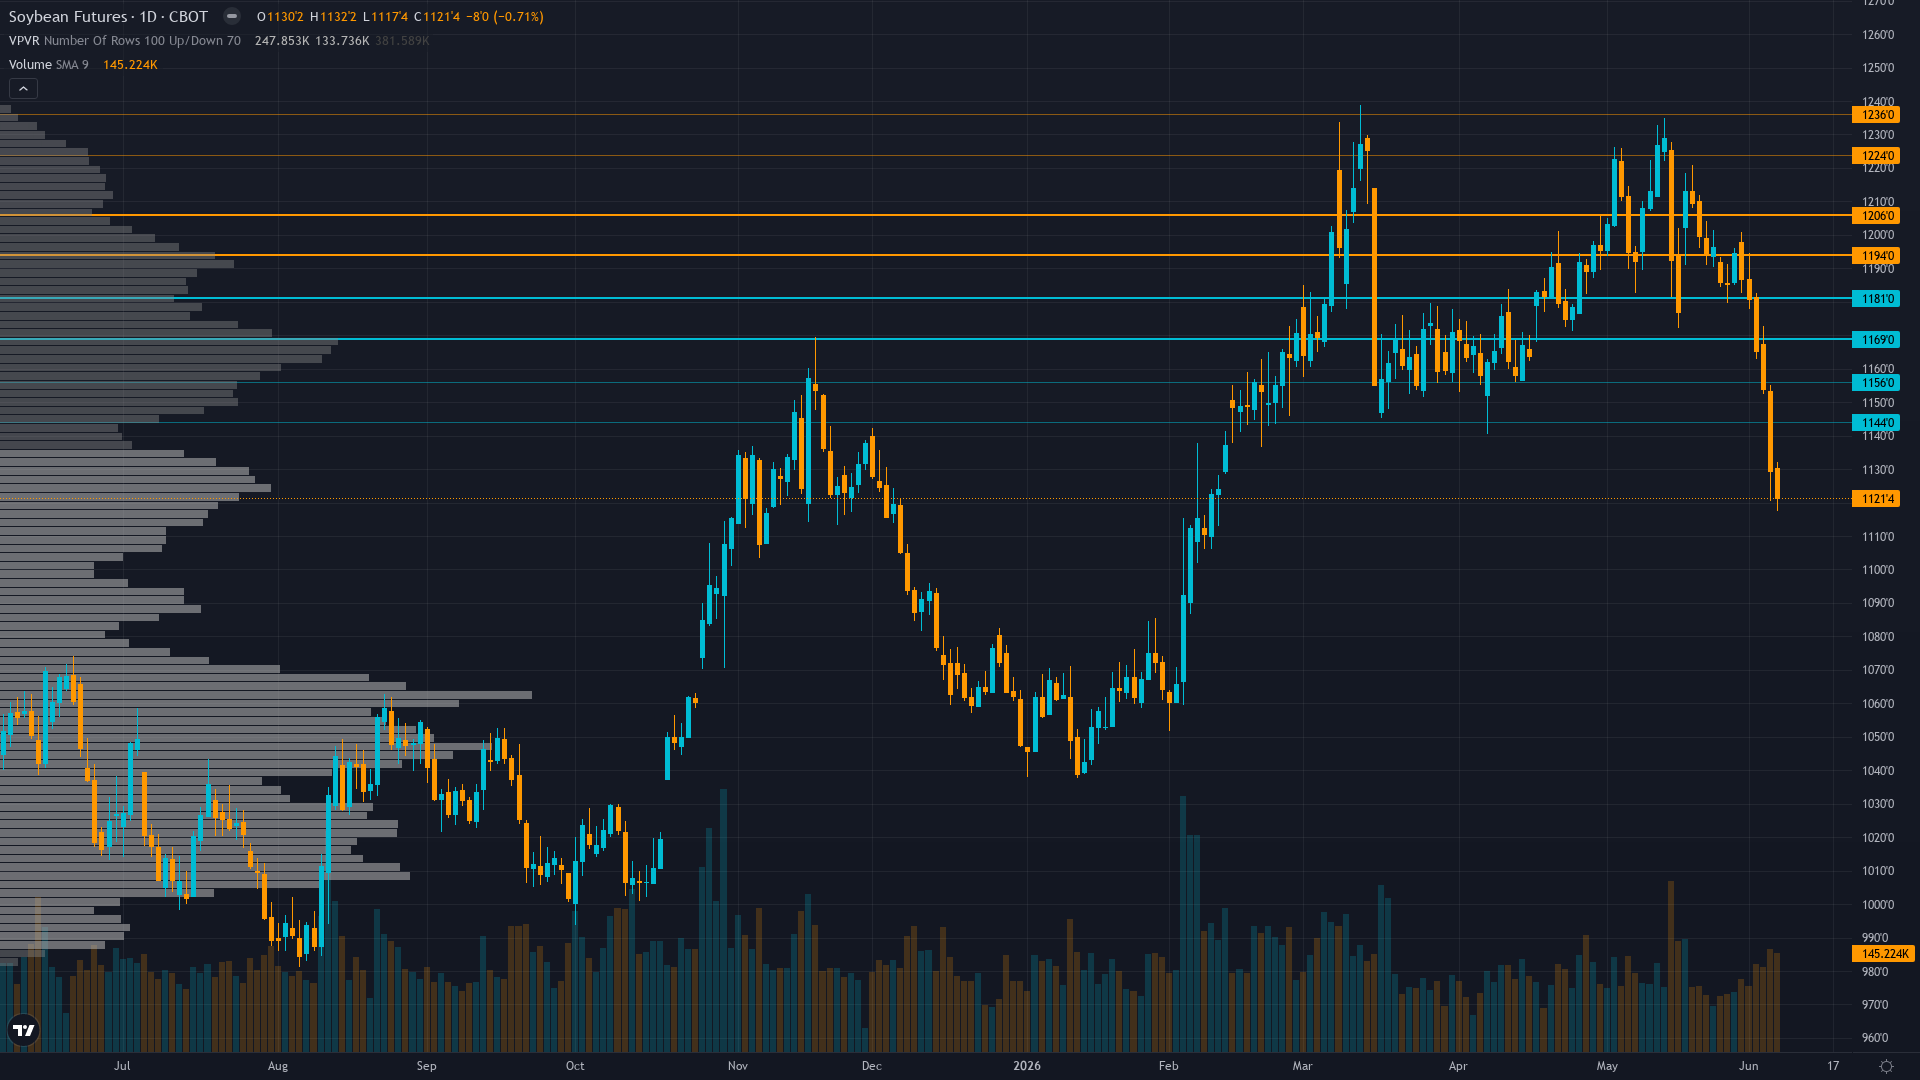
soybeans sits at 1153.5, having shed 2.80% as bears maintain the upper hand.
Managed money aggressively liquidating from 211,337 to 155,780 net longs (-26% or 55,557 contracts) in week ending June 2 representing largest single-week unwind in recent months, signaling sharp reversal in speculative conviction ahead of WASDE with commercials maintaining structural short hedge positions
Where We Agree & Diverge
Market consensus: Mixed with technical bears citing breakdown momentum and positioning liquidation offset by fundamental bulls noting declining stocks-to-use ratio and renewable diesel structural support creating range-bound consolidation expectations ahead of June 11 WASDE binary event
Primary driver: Signal magnitude -0.2 falls well below 1.0 minimum threshold for AGRICULTURAL directional bias per Rule 2, mandating NO CALL despite severe discipline conflicts and material -5.44% weekly decline, as June 11 WASDE binary catalyst 4 days away combined with weak crop conditions and managed money liquidation create genuine two-way risk where neither direction shows sufficient edge
Consensus Gaps
NO CALL bias limits divergence potential to low range despite desk identifying renewable diesel structural demand floor at 2.75B bushels as underpriced support, as signal below minimum threshold prevents meaningful contrarian statement and analysis largely confirms mixed market consensus of two-way risk ahead of June 11 WASDE rather than opposing clear directional view
Sentiment Analysis
Positioning in soybean futures is balanced, with neither bulls nor bears holding a decisive edge. Neutral sentiment typically precedes a directional catalyst.
Derivatives Intelligence
Insufficient data availability for ZS agricultural futures options prevents meaningful directional assessment, thin liquidity characteristic of agricultural options markets reduces signal contribution to near-zero
Net Assessment
The institutional landscape for soybean price shows fear sentiment. Trend strength is low at 3/10, indicating weak directional conviction and potential for range-bound behaviour. The combination of positioning data, sentiment, and options flow provides context for understanding where smart money is leaning heading into the week.
This analysis covers one dimension. Our full weekly report combines six specialist agents into a single actionable briefing with directional bias, key levels, and risk-opportunity matrix.
Start Free — Get the Market of the WeekFree weekly report · No credit card · Upgrade anytime