Soybeans COT & Institutional Positioning — Smart Money Analysis
Soybeans institutional positioning: COT data, sentiment analysis and smart money flow assessment.

Institutional Positioning
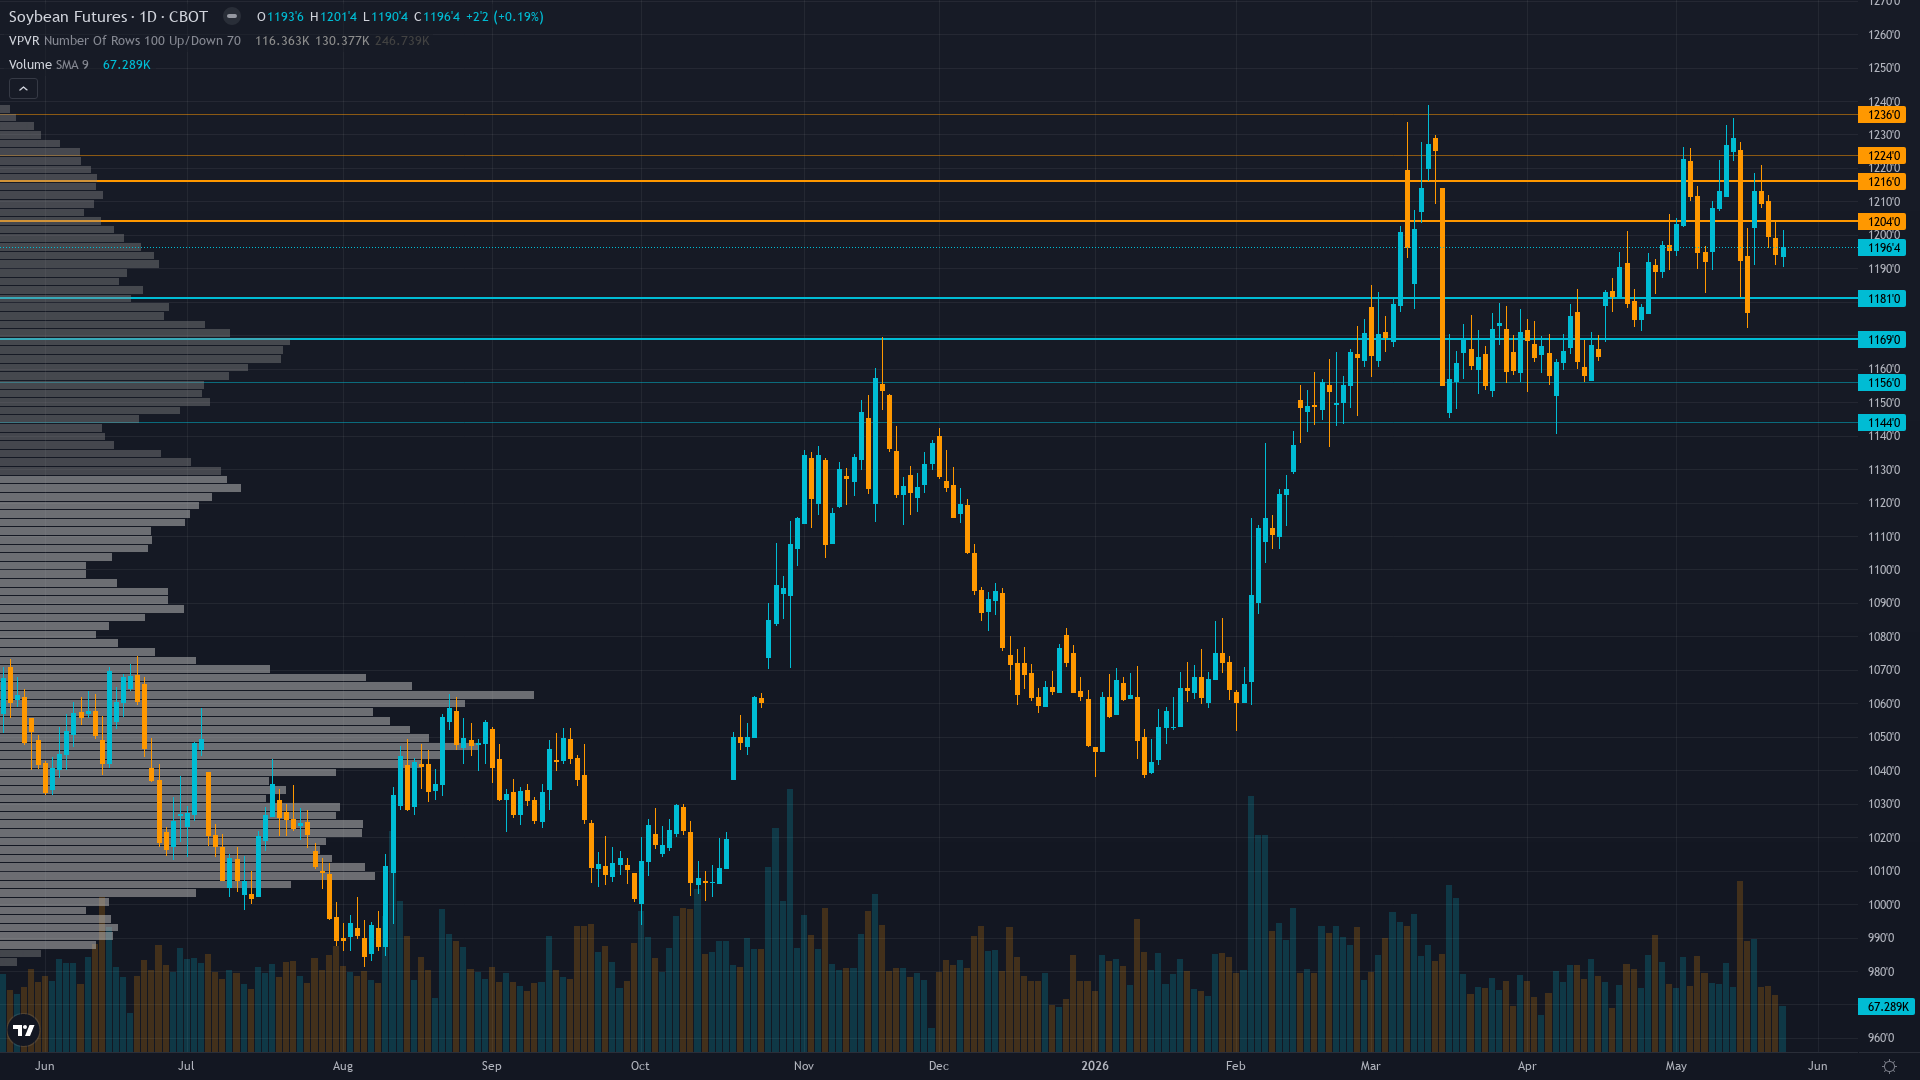
Trading at 1197.25 with a 0.36% uptick, soybeans is drifting higher without strong conviction.
Managed money at 232K net long contracts as of May 6 (up 38.3K representing 19.8% weekly increase) confirming strong bullish conviction before May 13 peak, though current week data unavailable likely shows profit-taking liquidation from -2.7% pullback creating near-term positioning headwind offset by seasonal pattern favoring strength into summer planting period
Crowd Psychology
Neither side has committed heavily to soybean futures, leaving sentiment in a neutral zone that offers little directional guidance on its own.
Options Flow
Limited data availability prevents meaningful directional assessment as thin agricultural options liquidity characteristic of ZS futures reduces signal strength to near-zero contribution, implied volatility likely elevated from May 12-13 WASDE window but specific levels unavailable
Market Consensus vs Our Analysis
Market consensus: Mixed with technical analysts noting consolidation fatigue after two-year highs offset by fundamental bulls citing WASDE declining stocks-to-use ratio and renewable diesel structural support creating range-bound expectations between 1175-1210 with directional resolution pending export sales confirmation and June weather developments
Primary driver: May 12 WASDE revealed declining US stocks-to-use ratio despite 4.435B bushel production increase creating fundamental support, but market showing consolidation fatigue after May 13 two-year high of 1230 cents followed by -2.7% pullback to 1193 as traders digest tighter balance sheets versus near-term positioning exhaustion and Brazilian pricing $0.80-$1.00/bu discount maintaining persistent 8-10% export competitiveness gap
Putting It Together
In summary, the positioning picture for soybeans reflects neutral conviction levels set against a consolidating after rejection from highs market backdrop. Trend strength at 5/10 paints a picture of a market with some direction but lacking strong conviction. The interplay between smart money activity, retail sentiment, and options market signals will shape how this positioning resolves.
This analysis covers one dimension. Our full weekly report combines six specialist agents into a single actionable briefing with directional bias, key levels, and risk-opportunity matrix.
Start Free — Get the Market of the WeekFree weekly report · No credit card · Upgrade anytime


