Soybeans COT & Institutional Positioning — Smart Money Analysis
Soybeans institutional positioning: COT data, sentiment analysis and smart money flow assessment.

Institutional Positioning
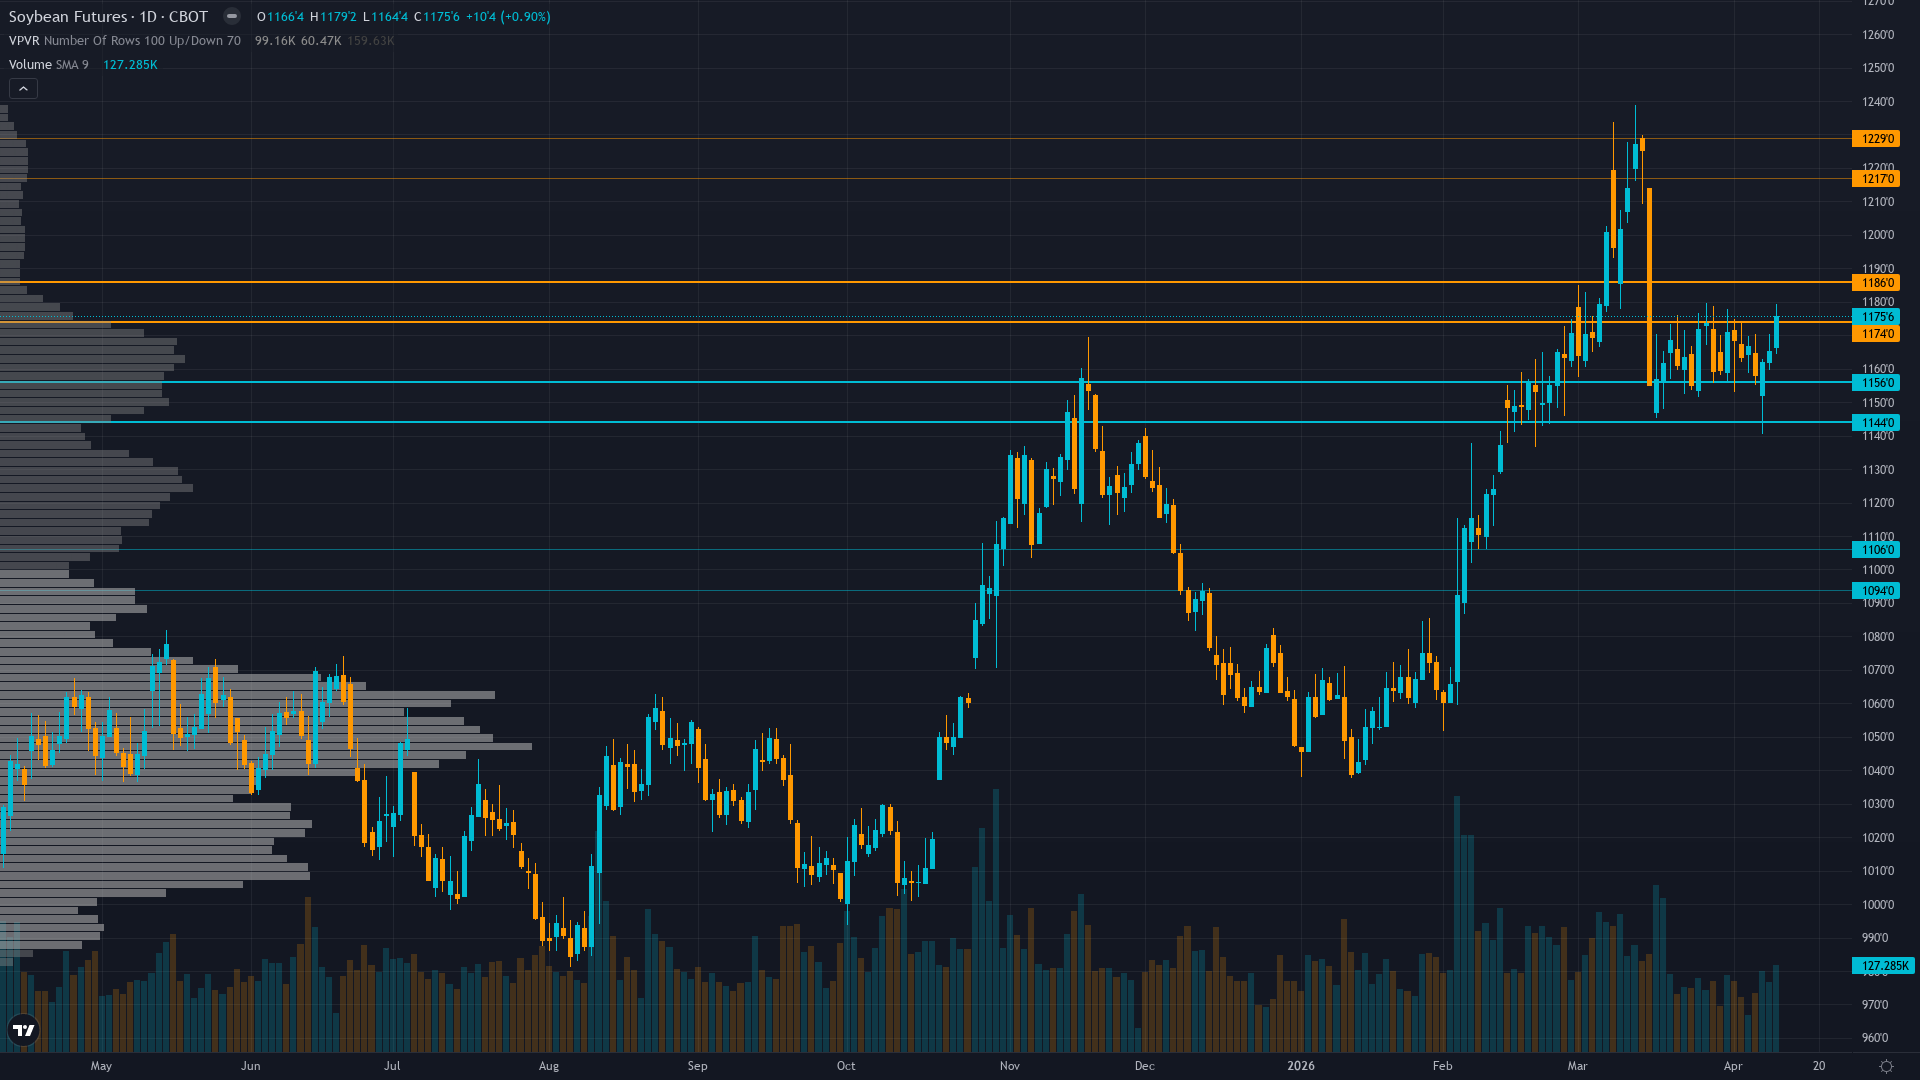
At 1168.5, soybeans has inched 0.52% higher in a measured advance.
Funds aggressively liquidating from peak positioning with 23,777 contract reduction in single week representing largest unwind since February, but remaining net long at 208.5K contracts still reflects constructive medium-term view
Where We Agree & Diverge
Market consensus: Mixed with bullish fundamental analysts citing WASDE validation and renewable diesel structural support offset by bearish macro analysts noting dollar strength and positioning profit-taking creating range-bound consolidation expectations
Primary driver: April 9 USDA WASDE report raised season-average soybean price forecast to $10.30/bushel (up $0.10) while holding ending stocks unchanged at 350 million bushels, validating tight supply-demand balance with 8.2% stocks-to-use ratio below 10-year average
Consensus Gaps
Desk identifies renewable diesel structural demand floor at 2.8-3.0B bushels as underpriced support that consensus underweights versus overweighting dollar strength and positioning liquidation whose impact may be transitory, creating moderate divergence but directional lean toward BULLISH with conviction 5 below threshold for strong contrarian claim
Sentiment Analysis
Positioning in soybean futures is balanced, with neither bulls nor bears holding a decisive edge. Neutral sentiment typically precedes a directional catalyst.
Derivatives Intelligence
Limited data availability for ZS agricultural options with thin liquidity preventing meaningful directional signal extraction, implied volatility declining from elevated levels as USDA report uncertainty resolves
Net Assessment
The institutional landscape for soybean price shows neutral sentiment. Trend strength registers at 6/10, suggesting meaningful but not extreme directional bias. The combination of positioning data, sentiment, and options flow provides context for understanding where smart money is leaning heading into the week.
This analysis covers one dimension. Our full weekly report combines six specialist agents into a single actionable briefing with directional bias, key levels, and risk-opportunity matrix.
Start Free — Get the Market of the WeekFree weekly report · No credit card · Upgrade anytime


