Silver Key Levels This Week — Support, Resistance & Confluence Zones
Silver key levels breakdown: support zones, resistance zones, confluence and price structure.

Structural Assessment
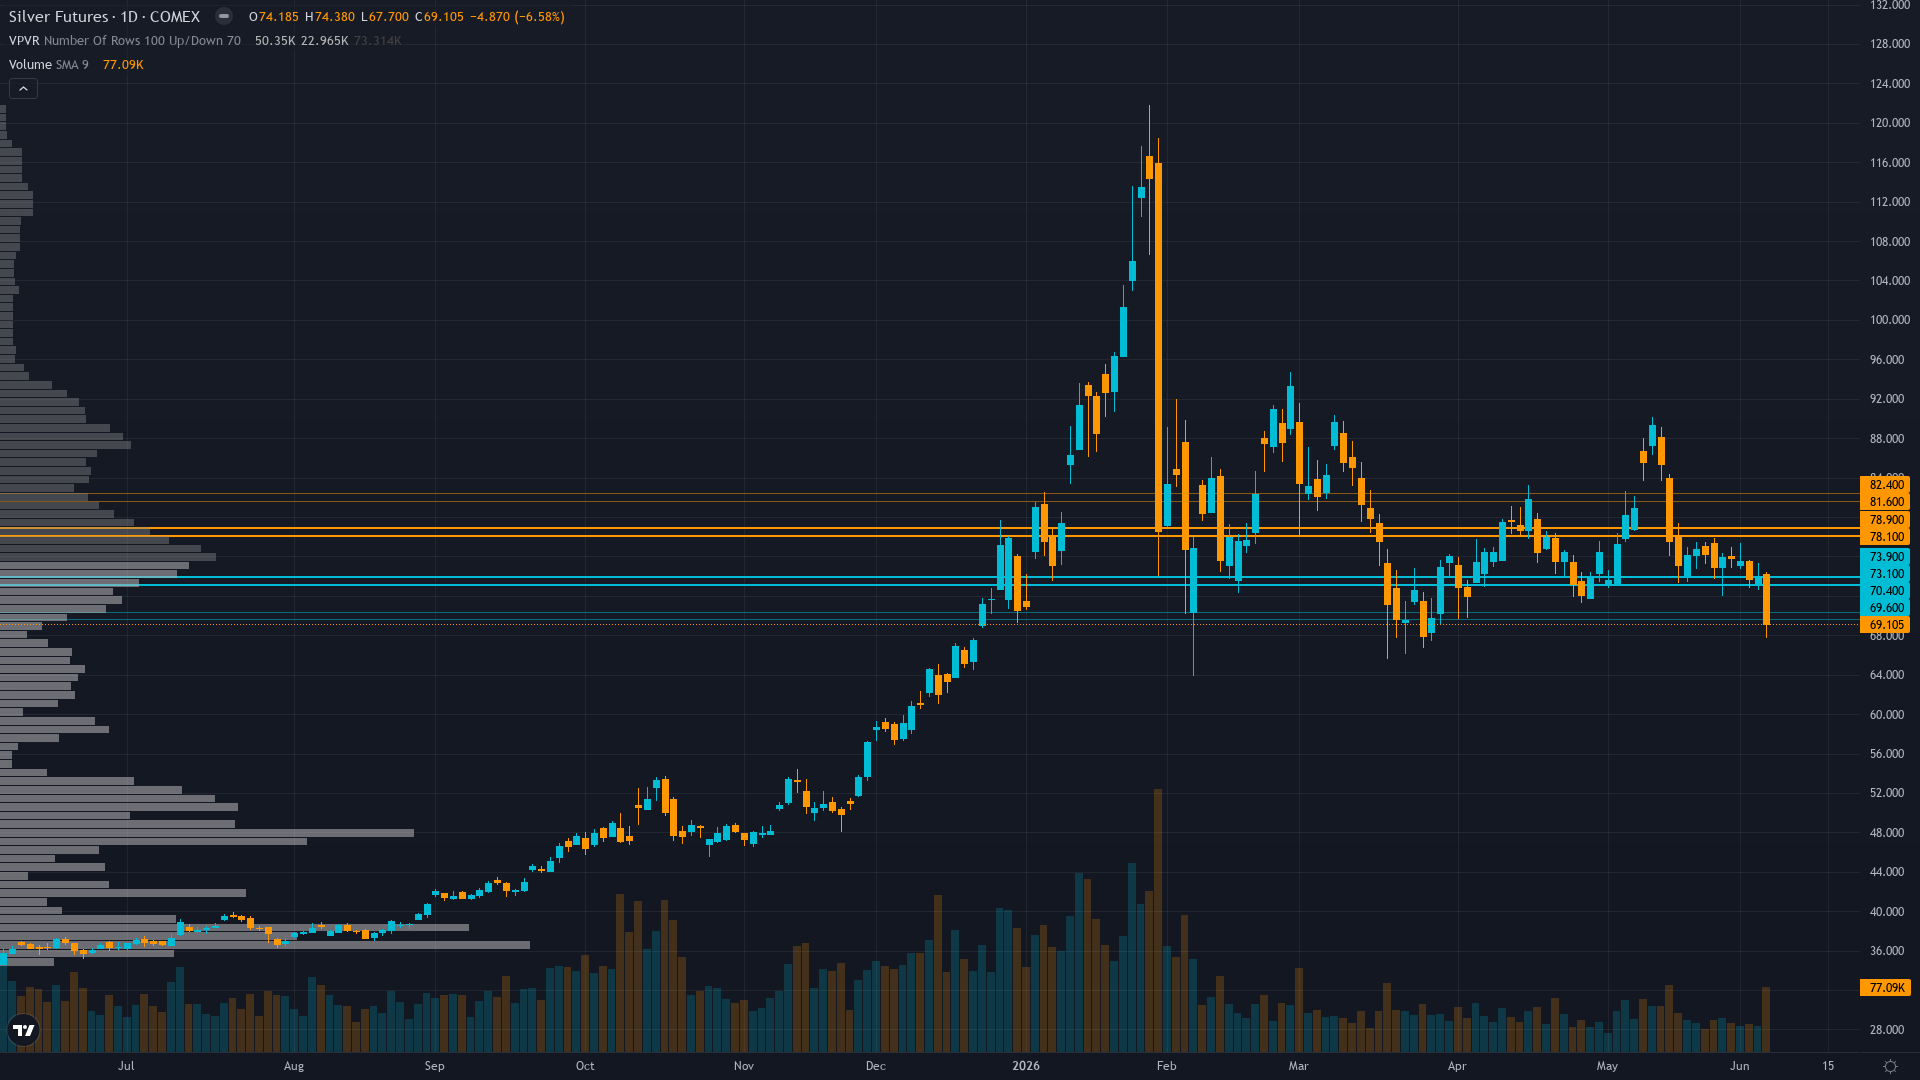
silver is trading at 69.1, down 6.58% as selling pressure weighs on price. silver futures is in a breaking down market state, requiring careful assessment of current conditions.
Sharp downtrend with price at $69.10 down -6.58% on June 7, trading below all key moving averages (50-day MA $75-77 range, 200-day $64.15), RSI neutral-weak, breakdown from parabolic January $121.79 peak structure confirmed, support at $67.70 intraday low critical validation level
At 2/10, trend strength is subdued, suggesting the market lacks a clear directional mandate.
Support Architecture
Support levels for silver are defined by zones of prior institutional demand. The depth and frequency of prior tests at these levels determines their likely strength.
The strength of support depends on the current breakdown continuation within secular bull structure following Fed-driven correction, approaching critical support zone where sixth-year structural deficit fundamentals may assert floor regime and volume profile at each level.
Upside Barriers
Resistance levels above COMEX silver current price represent zones of historical supply. The significance of each level scales with the number of prior tests and the volume traded there.
The current breaking down regime influences how aggressively these resistance zones are likely to be tested and whether they hold or fold.
Confluence & Methodology
Confluence is the differentiator between a line on a chart and a level worth trading. For silver futures, the zones with the highest conviction are those validated across technical, institutional, and derivatives dimensions simultaneously.
Beyond Lines on a Chart
Our approach to key levels is designed to filter noise from signal. Six independent agents each assess the same price zones from different perspectives. A level confirmed by one discipline is interesting. A level confirmed by four or five is worth building a trade plan around.
This multi-discipline approach means the levels in our paid reports carry institutional-grade confluence — not just lines on a chart, but zones validated across every analytical dimension that matters.
Our paid reports include specific support and resistance levels identified by six specialist agents — technical structure, institutional positioning, options flow, fundamentals, sentiment, and economic analysis. Not just lines on a chart, but zones validated by multi-discipline confluence.
Start Free — Get the Market of the WeekFree weekly report · No credit card · Upgrade anytime


