Silver Key Levels This Week — Support, Resistance & Confluence Zones
Silver key levels breakdown: support zones, resistance zones, confluence and price structure.

Structural Assessment
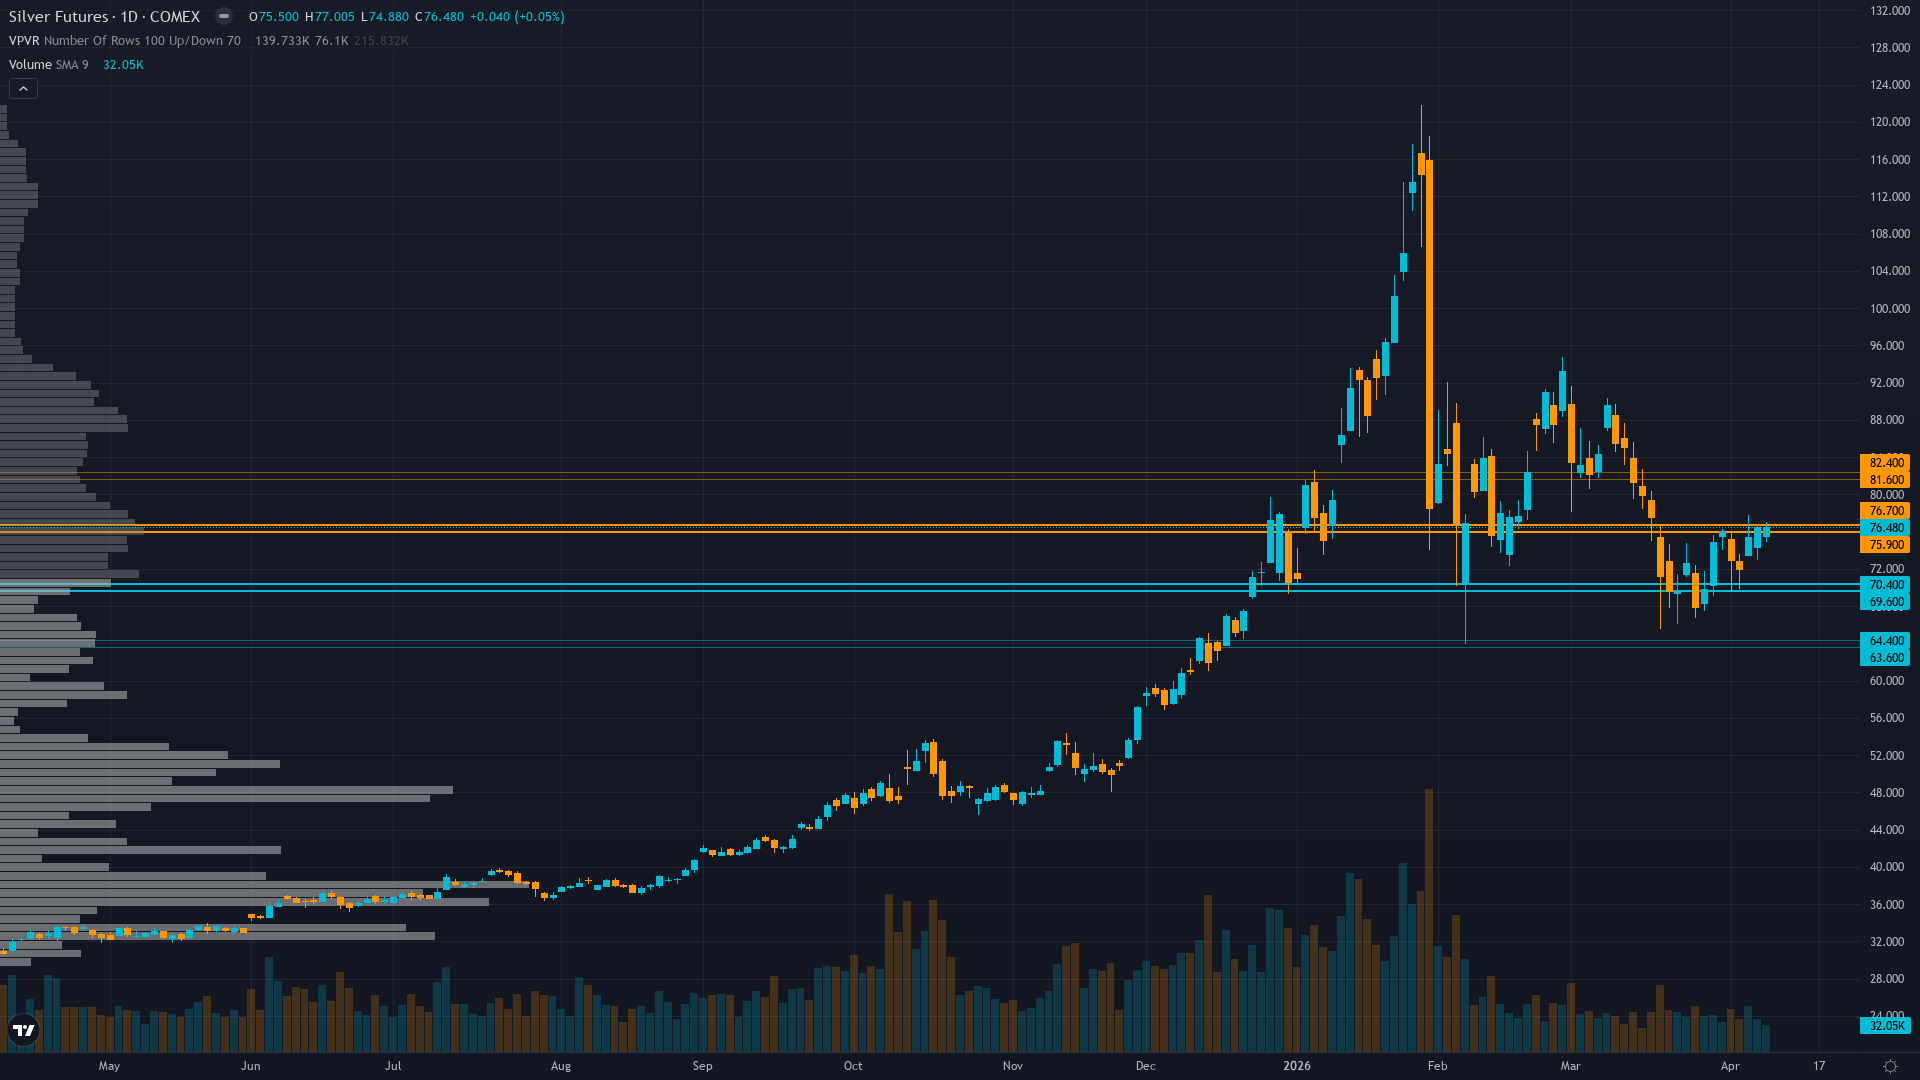
silver stands at 76.26, having rallied 1.25% as bulls press their advantage. silver futures is consolidating, with price compressing into a narrower range as the market builds energy for its next move.
Consolidating in $74-78 range after recovering from March 29 low of $69.77, price at $76.26 trading well above 200-day MA at $57 but 14% below 50-day MA at $87, RSI at 63 indicates healthy momentum without overbought conditions
At 6/10, trend strength indicates a solid directional lean without being overextended.
Support Architecture
Support levels for silver are defined by zones of prior institutional demand. The depth and frequency of prior tests at these levels determines their likely strength.
The strength of support depends on the current transitional consolidation following geopolitical shock resolution regime and volume profile at each level.
Upside Barriers
Resistance levels above COMEX silver current price represent zones of historical supply. The significance of each level scales with the number of prior tests and the volume traded there.
The current consolidating regime influences how aggressively these resistance zones are likely to be tested and whether they hold or fold.
Confluence & Methodology
Confluence is the differentiator between a line on a chart and a level worth trading. For silver futures, the zones with the highest conviction are those validated across technical, institutional, and derivatives dimensions simultaneously.
High volatility at 82nd percentile requires stops 12-18% below entry versus normal 4-6% with daily ranges now 5-7% versus typical 2-3%, making intraday swings volatile but directional conviction viable; breakout above $78.50 becomes reliable continuation signal toward $82-85 if sustained, while breakdown below $74 accelerates correction risk to $70-72
Beyond Lines on a Chart
Our approach to key levels is designed to filter noise from signal. Six independent agents each assess the same price zones from different perspectives. A level confirmed by one discipline is interesting. A level confirmed by four or five is worth building a trade plan around.
This multi-discipline approach means the levels in our paid reports carry institutional-grade confluence — not just lines on a chart, but zones validated across every analytical dimension that matters.
Our paid reports include specific support and resistance levels identified by six specialist agents — technical structure, institutional positioning, options flow, fundamentals, sentiment, and economic analysis. Not just lines on a chart, but zones validated by multi-discipline confluence.
Start Free — Get the Market of the WeekFree weekly report · No credit card · Upgrade anytime


