Silver Forecast This Week — Outlook, Drivers & Key Levels
This week's Silver outlook: key drivers, volatility context, risk-opportunity assessment and the week ahead.

Where Things Stand
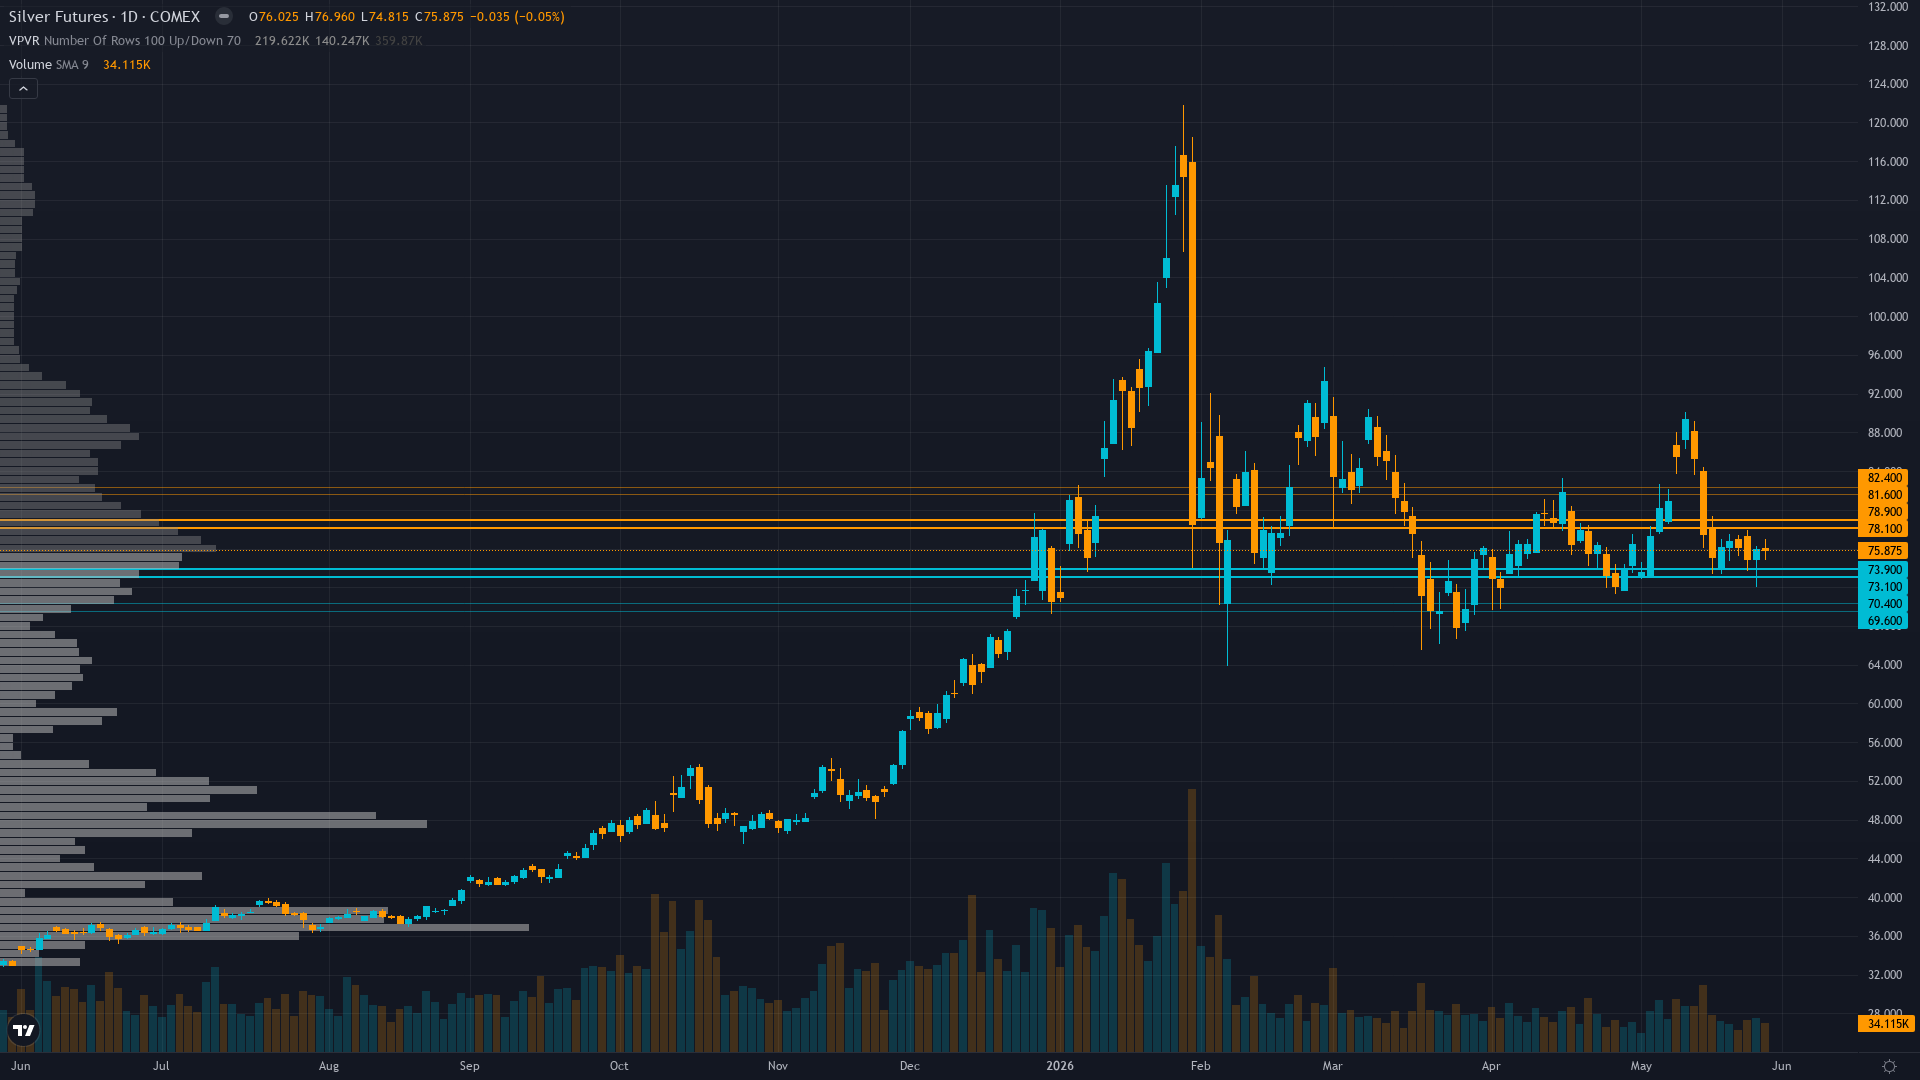
silver sits at 76.2 after slipping 0.43% — a shallow pullback rather than a decisive move. silver futures is consolidating, with price compressing into a narrower range as the market builds energy for its next move.
Market consensus fractured between structural bulls targeting $80-90 recovery by Q3 on intact sixth-year deficit fundamentals and cautious bears projecting $70-75 extended consolidation on Fed restrictive policy and demand deterioration, with CoinCodex algorithm predicting +3.33% to $77.86 by June 6 suggesting modest bullish algorithmic lean while J.P. Morgan maintains $81/oz average 2026 target
What's Driving Price
Primary driver: May 12-15 inflation surprise driving 10Y yields to 4.473% and 30Y above 5% sustains dollar strength (DXY 98.97) and real yields above 2.0% creating mathematical headwind for non-yielding silver despite sixth consecutive year of 67M oz structural deficit remaining fundamentally intact
Secondary factor: Sixth-year structural deficit (67M oz 2026 forecast per Silver Institute) with permanent 59% industrial demand shift from solar/EV/AI sectors remains constructively unchanged, yet fresh PV Magazine April 15 data documents solar silver demand declining 19% in 2026 to 151M oz from 186.6M oz in 2025 as substitution/thrifting accelerates at elevated price levels, introducing demand elasticity headwind contradicting pure deficit thesis
Additional influence: Extreme retail positioning at 90% long (DailyFX data) creates contrarian bearish overhang while managed money positioning washed out to mid-range 10,039 contracts limits forced liquidation risk but also removes spontaneous upside fuel, requiring Fed dovish catalyst at June 17-18 FOMC to reverse dollar weakness and drive recovery toward $80-82 resistance
Economic backdrop: Fed on hold at 3.50-3.75% after May 12-15 inflation surprise drove 10Y yields to 4.473% and 30Y above 5% (first time since May 2025), real yields at 2.30% creating mathematical headwind for non-yielding assets, DXY at 98.97 showing strength (-0.36% YoY but +0.93% MoM), VIX at 15.32 below 20 threshold indicating risk-on regime yet precious metals consolidating
Fundamental assessment: Sixth consecutive year of 67M oz structural deficit with 59% industrial demand unchanged per Silver Institute April 15 report, but PV Magazine April 15 documentation of solar silver demand declining 19% in 2026 to 151M oz represents material demand deterioration headwind suggesting high prices driving substitution faster than deficit thesis assumes
Chart Assessment
Consolidating in $73-78 range after last week's correct BEARISH call (price fell -0.43% from $76.20 to $75.87), trading below 50-day MA at $77.63 but well above 200-day at $64.15, RSI neutral at 58-59 offering no directional conviction, multiple failed recovery attempts above $82 since May reinforcing overhead resistance
With trend strength at 5/10, the directional signal is present but far from decisive.
Risk & Opportunity
Primary risk: Fed June 17-18 FOMC reinforces hawkish stance interpreting May inflation surprise as sustained reacceleration not transitory, sustaining real yields above 2.0% and DXY above 100, triggering breakdown below $73.50 toward $70 psychological support as extreme retail positioning at 90% long forced to capitulate and solar demand deterioration narrative (PV demand down 19% per April 15 data) compounds monetary policy headwinds (Probability: medium)
Primary opportunity: Consolidation above $73-76 establishes foundation for recovery toward $80-82 as May inflation surprise proves transitory with June data moderating, enabling Fed at June 17-18 FOMC to signal dovish tilt weakening dollar below DXY 96 and driving real yields below 1.90%, allowing sixth-year structural deficit with 59% industrial demand to reassert while washed-out institutional positioning at 10k contracts provides upside fuel (Timeframe: 3-5 weeks through June 17-18 FOMC if inflation trajectory cooperates and Fed signals policy flexibility)
This week's edge: Market treating May 12-15 inflation surprise and May 15 -9% selloff as validation of secular bear trend invalidating structural deficit thesis, while desk recognizes this as Fed-driven cyclical consolidation within intact secular bull structure—sixth-year deficit with 59% industrial demand and China controlling 60-70% supply creates fundamental floor above $70-73 that consensus fear-driven models underestimate, but desk also acknowledges PV Magazine April 15 fresh data showing solar demand declining 19% in 2026 to 151M oz (first industrial offtake decline) introduces genuine demand elasticity headwind at $75-80 levels that pure deficit bulls ignore, creating nuanced view where near-term bearish momentum requires confirmation of $73-76 support defense before bias reversal while medium-term structural scarcity remains constructive above $70 floor
Volatility Backdrop
silver price is in a high-volatility environment (82th percentile over 90 days), where position sizing discipline becomes critical. Volatility remains anchored at current levels, with no clear signal of an imminent regime shift in either direction.
High volatility at 82nd percentile requires stops 12-18% below entry versus normal 4-6% with daily ranges now 5-7% versus typical 2-3%, making intraday swings volatile but directional conviction viable; breakdown below $73.50 becomes reliable continuation signal toward $67-70 if sustained 2+ days, while successful hold above $76 with declining volatility signals potential bottom formation though resistance at $78.50-82 remains formidable
The Week Ahead
Federal Reserve June 17-18 FOMC meeting expected to hold rates unchanged at 3.50-3.75% with critical focus on dot plot and forward guidance for remainder of 2026, whether Fed acknowledges May inflation surprise as transitory or reinforces restrictive stance sustaining real yields above 2.0% and dollar strength on Wednesday 17 June is a high-impact catalyst with the potential to redefine the near-term outlook entirely.
How silver navigates the confluence of consolidating conditions and incoming data will determine whether the current directional thesis holds or breaks.
This analysis covers one dimension. Our full weekly report combines six specialist agents into a single actionable briefing with directional bias, key levels, and risk-opportunity matrix.
Start Free — Get the Market of the WeekFree weekly report · No credit card · Upgrade anytime