Silver Forecast This Week — Outlook, Drivers & Key Levels
This week's Silver outlook: key drivers, volatility context, risk-opportunity assessment and the week ahead.

Where Things Stand
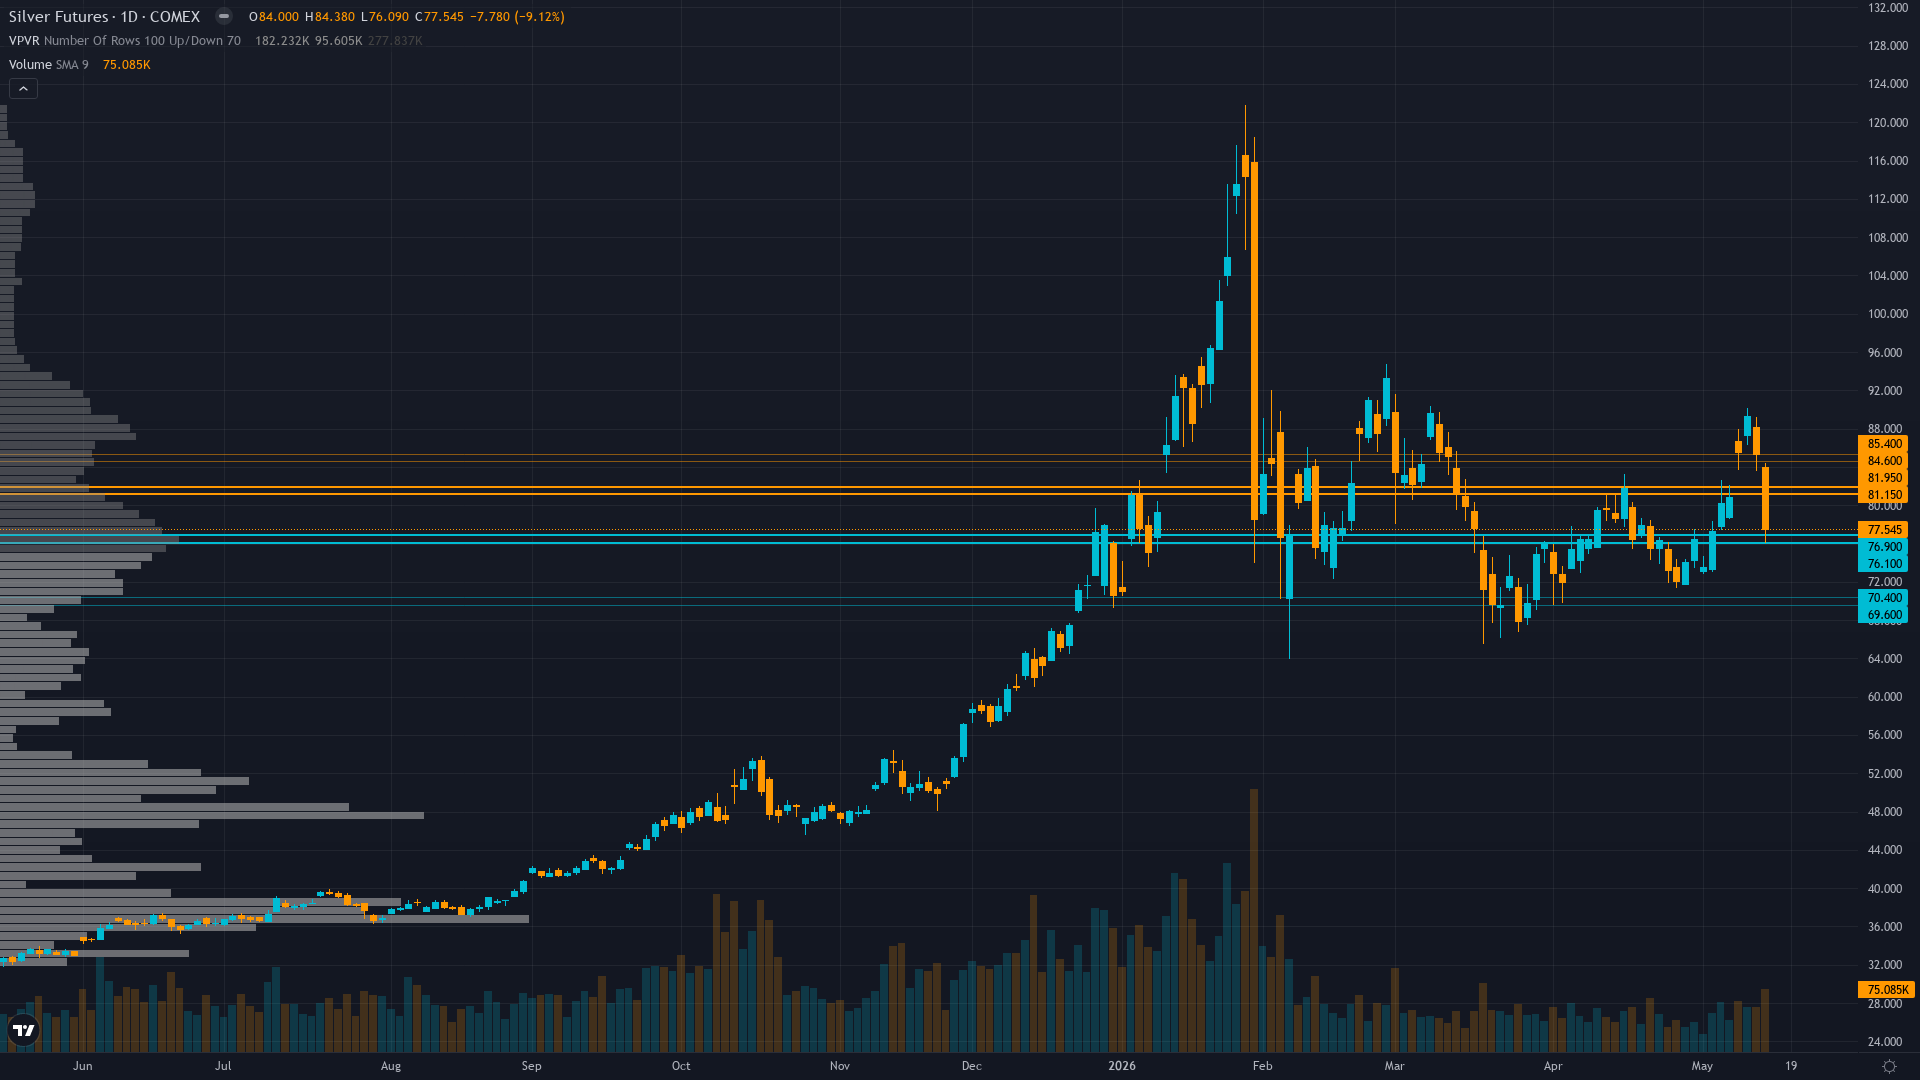
At 77.55, silver has dropped 9.12% with sellers in control of the session. silver futures is in a breaking down market state, requiring careful assessment of current conditions.
Market consensus fractured with CoinCodex algorithm predicting -15.24% decline to $64.38 by May 23 suggesting algorithmic bearish lean, while GoldSilver analysts note structural deficit fundamentals remain supportive medium-term creating wide forecast dispersion reflecting uncertainty following May 15 breakdown
What's Driving Price
Primary driver: May 15 cross-asset selloff with silver falling -9.18% to $75.75 (Trading Economics) in single session as inflation fears mounted per CNBC report, with Technical Agent documenting breakdown below 50-day MA at $77.63 confirming near-term bearish momentum despite sixth-year structural deficit remaining fundamentally intact
Secondary factor: UBS May 14 report (3 days ago) downgrading supply deficit forecast to 60-70M oz from prior estimates represents fresh fundamental headwind contradicting Silver Institute's 67M oz shortage projection, introducing demand destruction narrative at elevated price levels that market had not fully priced prior to this week's breakdown
Additional influence: Extreme retail positioning at 90% long (DailyFX/Capital.com data) facing forced liquidation risk as price breaks $77-78 support zone, while managed money at mid-range 10k contracts (low percentile) suggests institutional positioning already washed out limiting further downside from smart money but not preventing retail capitulation
Economic backdrop: Fed on hold at 3.50-3.75% after April 29 FOMC, May 15 cross-asset selloff driven by inflation fears per CNBC with bonds/stocks/precious metals all declining suggesting macro risk-off regime, real yields elevated creating headwind for non-yielding assets, VIX at 17.99 below 20 threshold yet precious metals selling indicating dollar strength dominance
Fundamental assessment: Sixth consecutive year of 67M oz structural deficit with 59% industrial demand from solar/EV/AI sectors remains intact per Silver Institute February 2026, BUT UBS May 14 report projecting deficit narrowing to 60-70M oz introduces demand destruction headwind at elevated price levels not fully reflected in prior analysis, creating fundamental conflict between structural scarcity and high-price elasticity
Chart Assessment
Breakdown below 50-day MA at $77.63 with May 15-17 decline from $85+ to current $77.55 representing -9% two-day move, price now 5.9% below 50-day MA but 21% above 200-day at $64.15, RSI declining toward 44-50 range neutral-weak, multiple failed recovery attempts above $82-85 reinforcing overhead resistance
With trend strength at only 3/10, any directional bias is thin and easily disrupted.
Risk & Opportunity
Primary risk: Breakdown below $73.50 support triggering cascade toward $70 psychological level if Fed June 17-18 FOMC reinforces hawkish stance or inflation data remains elevated, forcing extreme retail positioning at 90% long to capitulate creating self-reinforcing liquidation spiral despite structural deficit fundamentals (Probability: medium)
Primary opportunity: Successful defense of $73-76 support zone with stabilization creating platform for recovery toward $80-82 if Fed June FOMC signals any dovish tilt or inflation data moderates, allowing sixth-year structural deficit with 59% industrial demand to reassert as washed-out institutional positioning provides upside fuel (Timeframe: 2-4 weeks through June 17-18 FOMC if inflation trajectory cooperates)
This week's edge: Market treating May 15 -9% breakdown as validation of secular bear trend invalidating structural deficit thesis, while desk recognizes this as Fed-driven cyclical liquidation within intact secular bull structure—sixth-year deficit with 59% industrial demand and China controlling 60-70% supply creates fundamental floor above $70-73 that consensus fear-driven models underestimate, but UBS May 14 deficit revision to 60-70M oz introduces fresh demand elasticity headwind at elevated prices that pure deficit bulls ignore, creating opportunity to fade panic below $73-75 if support holds while acknowledging near-term bearish momentum requires confirmation of stabilization before reversing bias
Volatility Backdrop
silver price is in a high-volatility environment (82th percentile over 90 days), where position sizing discipline becomes critical. Volatility remains anchored at current levels, with no clear signal of an imminent regime shift in either direction.
High volatility at 82nd percentile requires stops 12-18% below entry versus normal 4-6% with daily ranges now 5-9% versus typical 2-3% making intraday swings violent; breakdown below $73.50 becomes reliable continuation signal toward $67-70 while successful hold above $75 with declining volatility signals potential bottom formation
The Week Ahead
Federal Reserve June 17-18 FOMC meeting expected to hold rates unchanged at 3.50-3.75% with focus on dot plot and forward guidance for remainder of 2026, critical inflection for whether Fed signals any dovish shift or maintains restrictive stance sustaining real yield pressure on precious metals on Wednesday 17 June is a high-impact catalyst with the potential to redefine the near-term outlook entirely.
How silver navigates the confluence of breaking down conditions and incoming data will determine whether the current directional thesis holds or breaks.
This analysis covers one dimension. Our full weekly report combines six specialist agents into a single actionable briefing with directional bias, key levels, and risk-opportunity matrix.
Start Free — Get the Market of the WeekFree weekly report · No credit card · Upgrade anytime


