Silver Forecast This Week — Outlook, Drivers & Key Levels
This week's Silver outlook: key drivers, volatility context, risk-opportunity assessment and the week ahead.

Current Market Picture
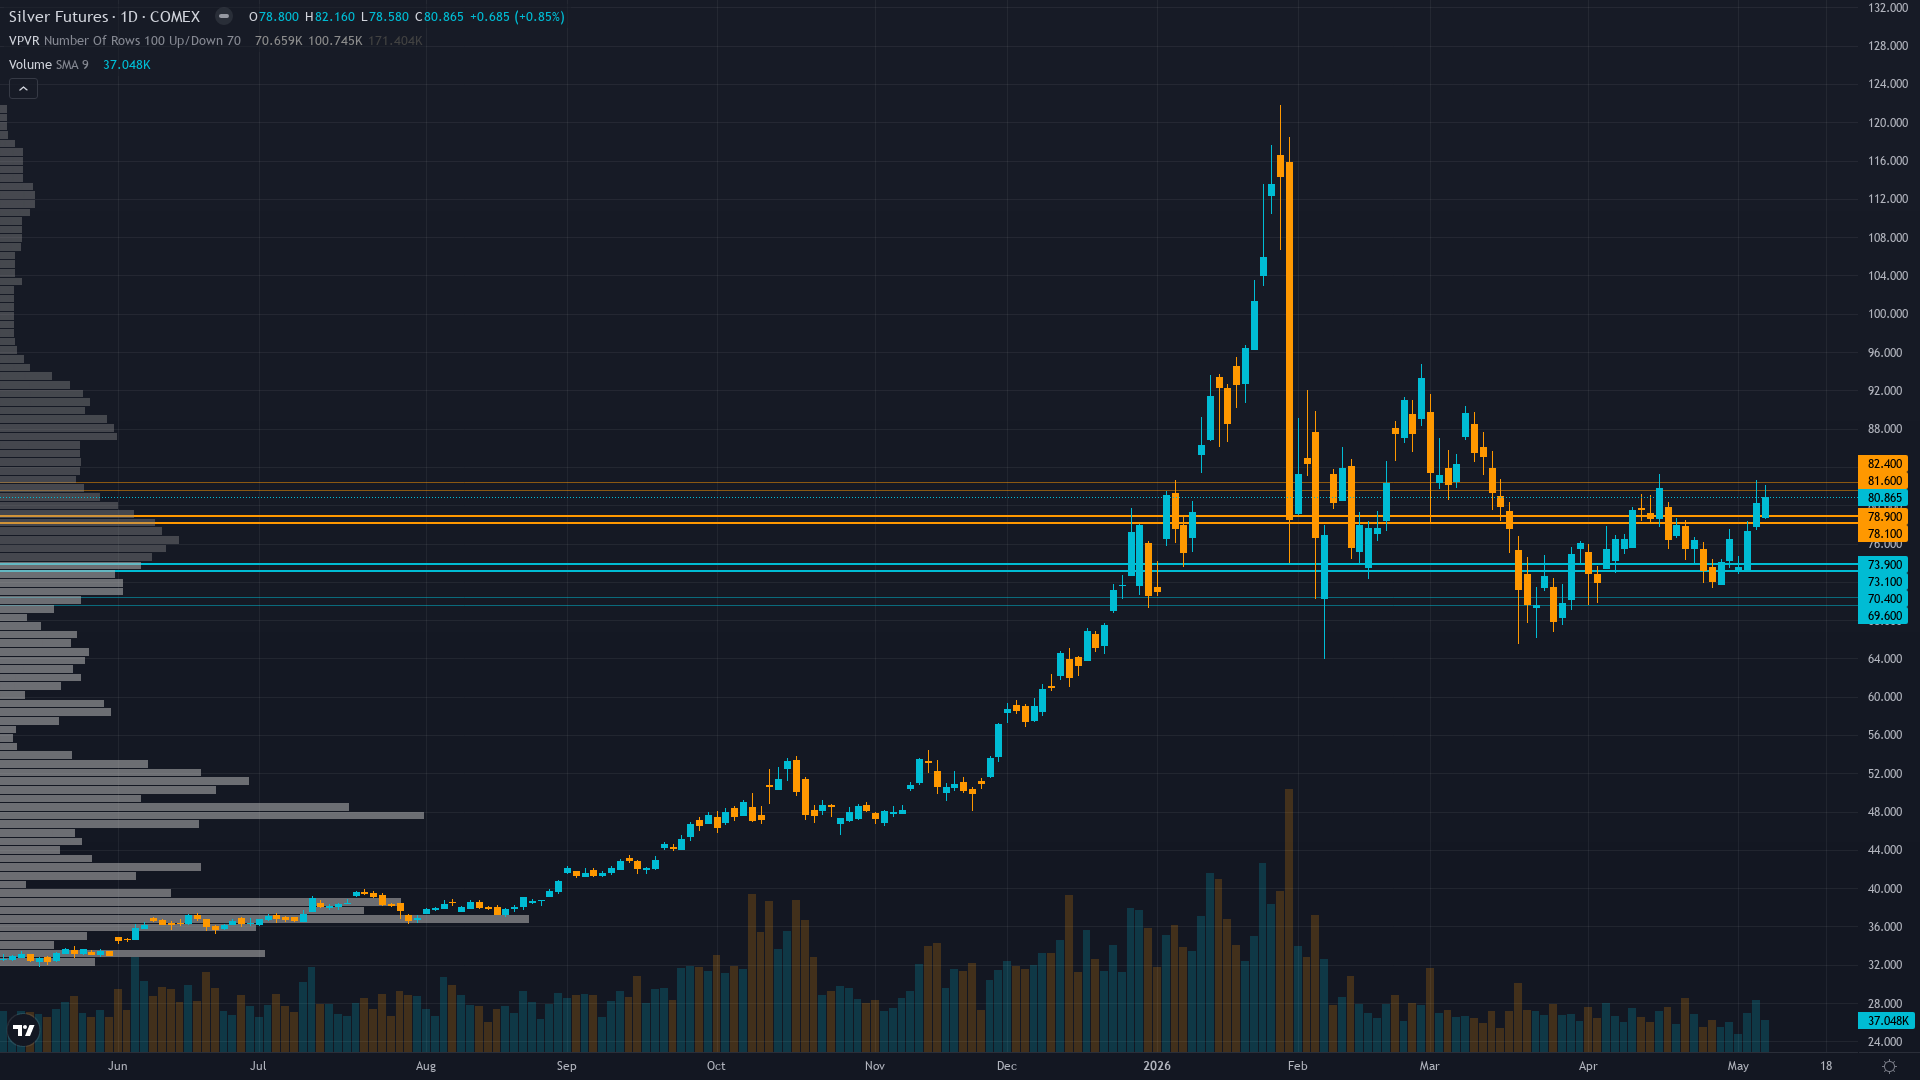
silver holds at 80, up a marginal 0.10% as the market grinds forward. The market in silver futures is coiling, with narrowing price ranges suggesting stored energy that will eventually release.
Market consensus fractured between structural bulls targeting $85-95 recovery on intact sixth-year deficit fundamentals and cautious neutrals awaiting May 12 CPI clarity; CoinCodex algorithm predicting +17.64% to $94.55 by May 16 suggests bullish algorithmic lean emerging post-May 7 surge
Key Drivers This Week
Primary driver: Silver exhibiting constructive base-building in $76-82 range following last week's sharp $5.05 single-day surge (May 7) and subsequent consolidation, as sixth consecutive year of structural deficit (67M oz shortfall, 59% industrial demand) collides with emerging demand deterioration warning from Silver Institute/Reuters documenting industrial fabrication declining 2% to four-year low from substitution/thrifting trends at elevated price levels
Secondary factor: Macro regime classification RISK-ON TRANSITIONAL: VIX at 17.39 signals clear risk-on sentiment (well below 20 threshold), yet precious metals consolidating rather than rallying because Fed's April 29 hawkish hold at 3.50-3.75% sustains real yields near 2.0% creating mathematical headwind for non-yielding assets despite broader market complacency—awaiting May 12 CPI binary catalyst 2 days away
Additional influence: Technical structure improved from last week with successful hold above $76-78 support and recovery toward $80 level, though 50-day MA at $81.17 represents immediate overhead resistance; managed money positioning at mid-range after January-April washout removes extreme long overhang while retail remains heavily long (82-90% per historical data) creating mild contrarian concern
Economic backdrop: Fed on hold at 3.50-3.75% after April 29 FOMC with no fresh dovish catalyst; 10Y TIPS real yields declining to 1.90% (down 6bp month-over-month) modestly supportive but still elevated; DXY at 97.91 weakening (-2.42% YoY); April CPI release May 12 at 8:30 AM EST (2 days away) represents next major binary event for inflation trajectory and Fed policy path
Fundamental assessment: Sixth consecutive year of 67M oz structural deficit with 59% industrial demand fundamentally intact per Silver Institute, BUT Reuters/Silver Institute February 2026 report documented industrial fabrication forecast declining 2% to 650M oz (four-year low) from thrifting/substitution in photovoltaic sector—this demand deterioration at $75-80 price levels suggests fundamental headwind contradicting pure deficit thesis
Price Structure
Consolidating in $76-82 range after May 7 $5.05 surge from $76.50 to $81.55 followed by pullback; price at $80 trading just below 50-day MA at $81.17 but well above 200-day near $60; RSI neutral offering no directional conviction; recent volatility (5-7% daily swings) demonstrates two-way uncertainty ahead of May 12 CPI
Trend strength at 5/10 paints a picture of a market with some direction but lacking strong conviction.
Upside & Downside
Primary risk: April CPI on May 12 shows inflation reacceleration above 3.2% forcing Fed to maintain restrictive stance through H2 2026, sustaining real yields above 2.0% and DXY strength, triggering breakdown below $76.50 toward $73-70 psychological support as industrial demand deterioration narrative (fabrication down 2% to four-year low per Silver Institute) compounds monetary policy headwinds and extreme retail positioning creates forced liquidation risk (Probability: medium)
Primary opportunity: April CPI on May 12 shows inflation moderation to 2.8% or below enabling Fed dovish shift at June 17-18 FOMC, weakening dollar below DXY 96 and driving real yields below 1.80%, catalyzing breakout above $81.55 (May 7 high) toward $85-88 resistance as sixth-year structural deficit with 59% industrial demand reasserts despite short-term fabrication headwinds and washed-out institutional positioning at mid-range provides upside fuel (Timeframe: 2-4 weeks through May 12 CPI and into late May if inflation data cooperates enabling Fed dovish tilt at June FOMC)
This week's edge: Market treating May 7 $5.05 surge and subsequent consolidation as noise rather than signal of underlying deficit fundamentals reasserting, while desk recognizes successful $76-78 support defense combined with sixth-year deficit (67M oz) creates asymmetric setup where downside limited by physical scarcity floor and washed-out institutional positioning (10,039 contracts mid-range) but upside requires May 12 CPI catalyst to break $81-82 resistance; critical insight is that Silver Institute February documentation of 2% industrial fabrication decline to four-year low from photovoltaic substitution introduces demand elasticity headwind at $75-80 levels that pure deficit models ignore—this creates vulnerability if CPI hot, but also means cool CPI enabling Fed dovish shift removes primary obstacle allowing deficit narrative to drive toward $85-90
Volatility Context
At the 82th percentile of its 90-day range, silver price volatility is running hot, creating both opportunity and risk for directional traders. Realised vol is holding its current level, suggesting the market has found a temporary equilibrium in its risk pricing.
Week Ahead Outlook
The next major catalyst is April CPI release at 8:30 AM EST on May 12, 2026—critical inflation data 2 days away that will shape Fed June 17-18 FOMC expectations and dollar trajectory; hot reading reaccelerates hawkish Fed stance sustaining real yields above 2.0%, cool reading validates wage moderation and enables dovish shift weakening dollar below DXY 96 on Tuesday 12 May — a high-impact event that could materially shift the directional picture.
For SI futures, the balance between existing momentum and scheduled risk events sets the stage for the week ahead.
This analysis covers one dimension. Our full weekly report combines six specialist agents into a single actionable briefing with directional bias, key levels, and risk-opportunity matrix.
Start Free — Get the Market of the WeekFree weekly report · No credit card · Upgrade anytime


