Silver Forecast This Week — Outlook, Drivers & Key Levels
This week's Silver outlook: key drivers, volatility context, risk-opportunity assessment and the week ahead.

This Week's Starting Point
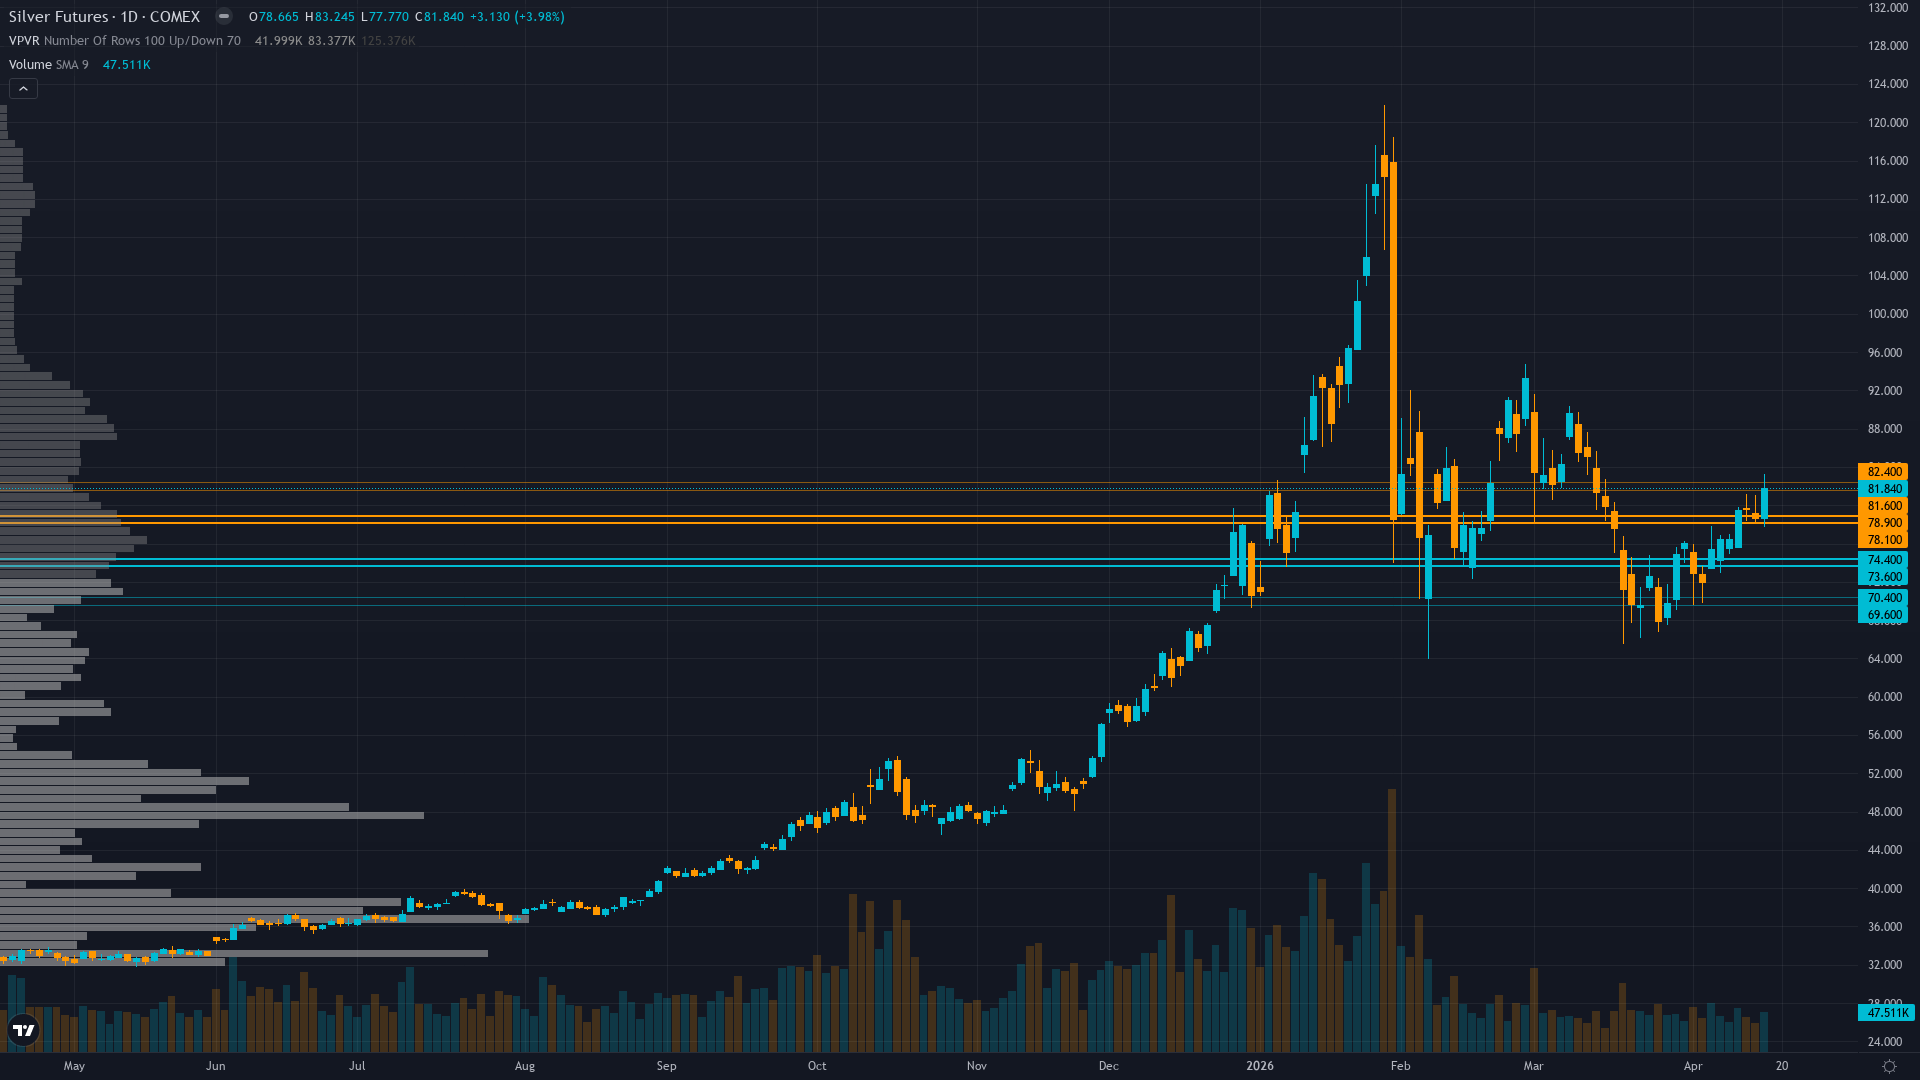
Trading at 81.84 after a 2.59% move higher, silver continues to attract buying interest. Price action in silver futures has compressed into a consolidation pattern, typically a precursor to a directional breakout.
Market consensus fractured between structural bulls targeting $85-95 recovery by Q2 on intact sixth-year deficit fundamentals confirmed April 15 and cautious neutrals awaiting April 29 Fed clarity, CoinCodex algorithm predicting +12.96% to $88.92 by April 23 suggests modest bullish lean emerging while J.P. Morgan February forecast of $81/oz average for 2026 already achieved
Forces in Play
Primary driver: Silver Institute World Silver Survey 2026 released April 15 confirms sixth consecutive year of structural deficit expanding to 46 million ounces (15% increase from 2025), with industrial demand consuming record 59% of supply from solar/EV/AI sectors creating fundamental scarcity while price at $81.84 trades 30-45% below fundamental fair value estimates of $113+
Secondary factor: Technical consolidation in $77-83 range above 50-day MA at $81.17 demonstrates constructive base-building with RSI neutral at 44.64 and successful defense of psychological $77-78 support creating platform for retest of $90-95 resistance as silver's 2.4x volatility versus gold creates leveraged precious metal exposure
Additional influence: Contrarian sentiment setup with euphoric retail positioning and hedge fund rotation out of precious metals in early February creating washed-out institutional landscape where managed money positioning reset from Q1 extremes while SLV outflows decelerating provides asymmetric upside fuel if Fed April 29-30 FOMC signals dovish shift
Economic backdrop: Fed on hold at 3.50-3.75% after March 18 hawkish pivot showing ONE 2026 cut in dot plot, USD at 98.20 creates modest headwind, Powell term expires May 2026 creating binary policy uncertainty, April 29-30 FOMC next major catalyst 10 days away with no fresh economic data this week creating low-information-edge environment
Fundamental assessment: Sixth consecutive year of 46M oz structural deficit per Silver Institute April 15 report with industrial demand at 59% of supply (700M+ oz annually from solar/EV/AI) unchanged and fundamentally constructive, mine supply inelastic at 820M oz while China export restrictions controlling 60-70% tradeable supply operational since January 1 create medium-term floor
Technical Landscape
Consolidating in $77-83 range trading just above 50-day MA at $81.17 and well above 200-day MA at $59.84, RSI neutral at 44.64 suggesting rangebound digestion not directional conviction, resistance at $83.25 April 16 high with support at $77.77 recent low creating 7% trading band
Trend strength registers at 6/10, suggesting meaningful but not extreme directional bias.
Risk-Reward Assessment
Primary risk: Fed April 29-30 FOMC reinforces hawkish stance interpreting any inflation data as sustained reacceleration rather than transitory, sustaining 10Y TIPS real yields above 2.0% and DXY above 100, triggering breakdown below $77.77 support toward $70-73 zone as remaining euphoric retail positioning (per Sentiment Agent crowd extreme detection) forced to capitulate despite structural deficit fundamentals (Probability: medium)
Primary opportunity: Consolidation above $77-81 establishes foundation for breakout toward $90-95 as Silver Institute April 15 deficit confirmation (46M oz expanding 15% from 2025) validates structural scarcity thesis while washed-out institutional positioning and decelerating SLV outflows create fuel for rally if Fed April 29-30 FOMC signals dovish shift weakening dollar below DXY 96 and driving real yields below 1.90% (Timeframe: 2-4 weeks through April 29-30 FOMC decision and into early May if Fed provides dovish catalyst enabling recovery toward $85-90 psychological resistance)
This week's edge: Market treating Silver Institute April 15 deficit confirmation (46M oz expanding 15% to sixth consecutive year) as incremental data point rather than validation of structural regime change, while desk recognizes combination of sixth-year deficit with permanent 59% industrial demand shift, China export weaponization controlling 60-70% supply, and washed-out institutional positioning (SLV outflows decelerating, hedge funds rotated out February) creates asymmetric setup where $81.84 current price trades 30-45% below fundamental fair value estimates of $113+ yet crowd euphoria (148% YoY gains, $100-500 predictions per Sentiment Agent) masks that institutions have already de-risked creating upside fuel if April 29-30 FOMC provides dovish catalyst
Risk Environment
With vol at the 82th percentile, silver price is trading in an elevated regime where daily ranges can surprise even experienced traders. Volatility is stable, with realised vol holding steady across timeframes. This equilibrium can persist but eventually resolves into expansion or contraction.
High volatility at 82nd percentile requires stops 12-18% below entry versus normal 4-6% with daily ranges now 5-7% versus typical 2-3%, making intraday swings volatile but directional conviction viable; breakout above $83.25 becomes reliable continuation signal toward $88-90 if sustained 2+ days, while breakdown below $77.77 accelerates correction risk to $70-73 though sixth-year structural deficit argues against sustained failure below $75-77
Looking Forward
All eyes turn to Federal Reserve April 29-30 FOMC meeting expected to hold rates unchanged at 3.50-3.75% with focus on forward guidance for remainder of 2026, whether Fed acknowledges recent price stability as inflation moderation allowing dovish pivot or reinforces restrictive stance maintaining dollar strength and real yield headwinds for non-yielding precious metals on Wednesday 29 April, which carries enough weight to force a decisive directional move.
The week ahead for silver futures hinges on whether the prevailing consolidating regime can absorb the scheduled catalysts without a regime shift.
This analysis covers one dimension. Our full weekly report combines six specialist agents into a single actionable briefing with directional bias, key levels, and risk-opportunity matrix.
Start Free — Get the Market of the WeekFree weekly report · No credit card · Upgrade anytime


