Silver Forecast This Week — Outlook, Drivers & Key Levels
This week's Silver outlook: key drivers, volatility context, risk-opportunity assessment and the week ahead.

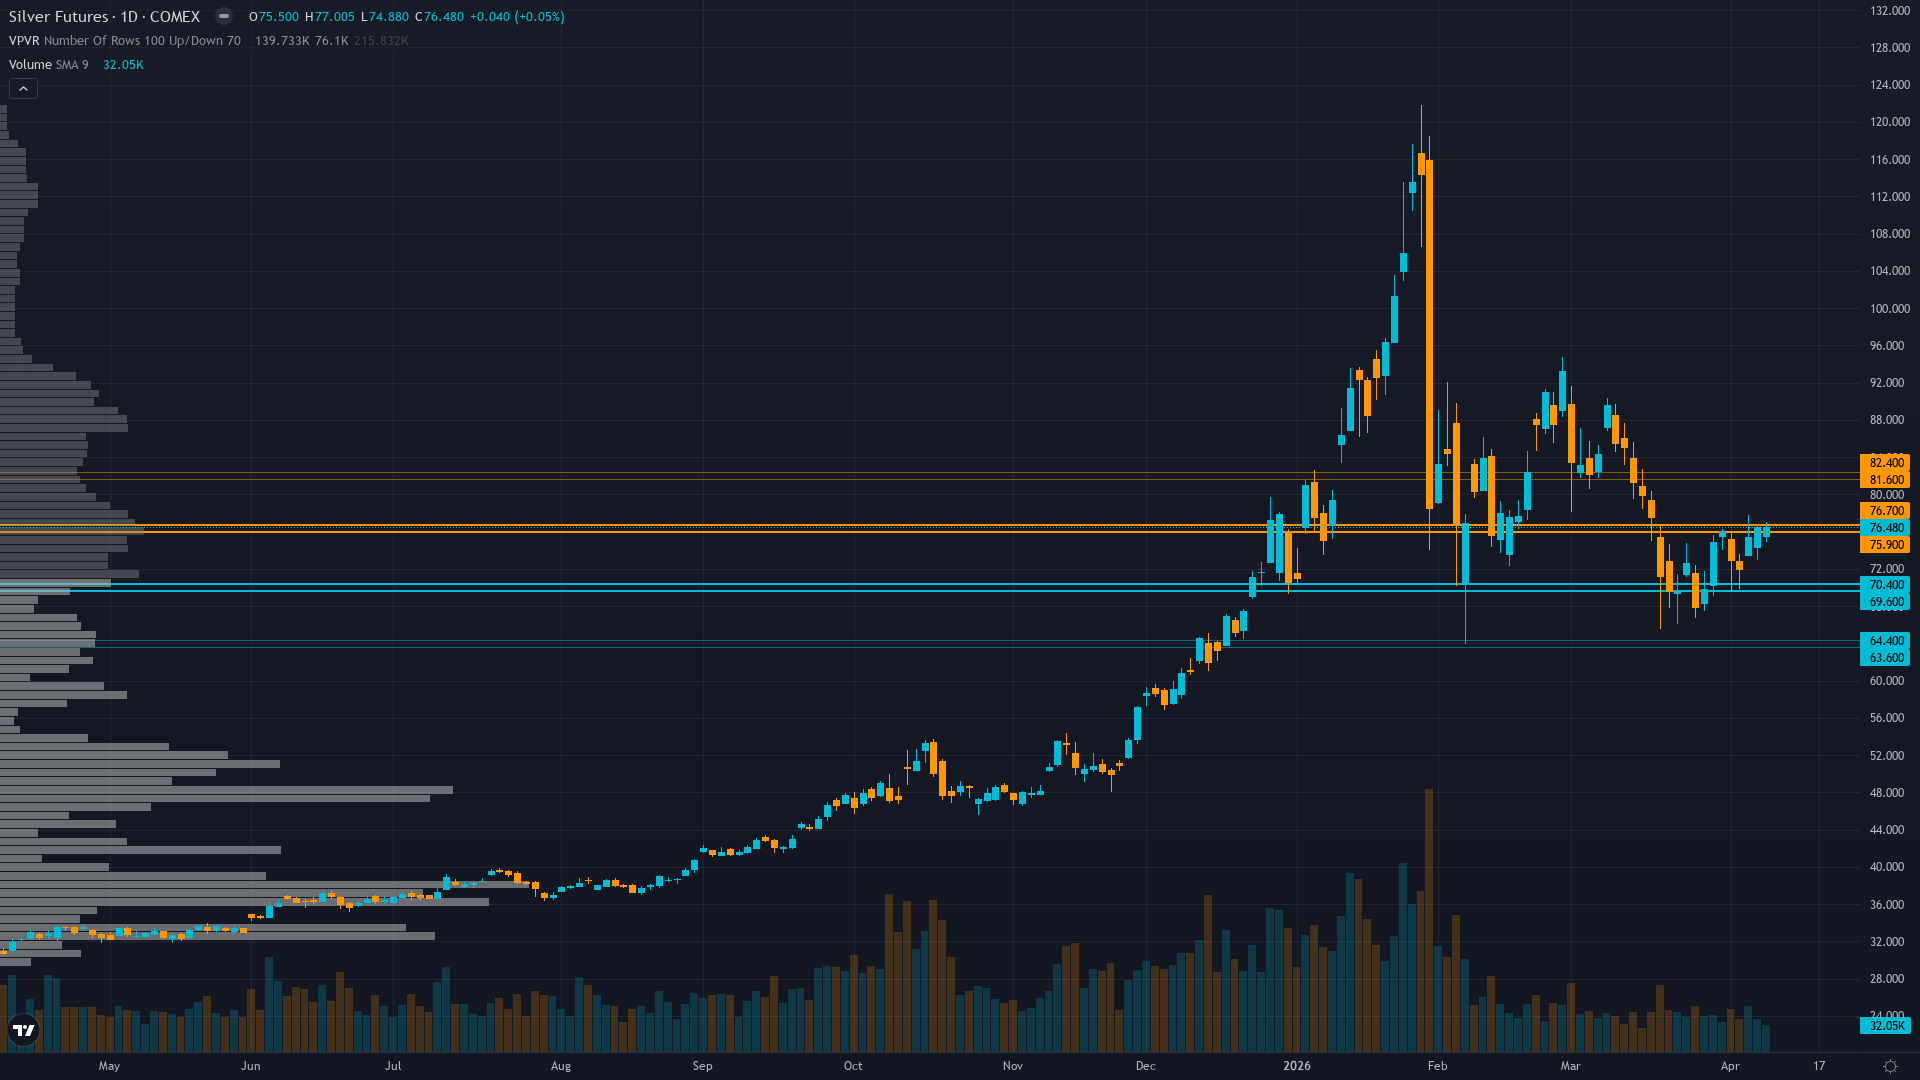
Where Things Stand
At 76.26, silver has gained 1.25% over the past session with buying pressure clearly in the driving seat. silver futures is consolidating, with price compressing into a narrower range as the market builds energy for its next move.
Market consensus fractured between structural bulls targeting $80-90 recovery by Q2 on intact deficit fundamentals and cautious neutrals awaiting April 29 Fed clarity, CoinCodex algorithm predicting +1.07% to $77.04 by April 16 suggests modest bullish lean emerging
What's Driving Price
Primary driver: Iran war ceasefire announcement reducing geopolitical risk premium triggered sharp oil price decline and easing inflation fears, creating paradox where safe-haven demand weakens but dollar strength from March CPI inflation shock (3.3% vs 2.4% prior) creates competing cross-current on precious metals
Secondary factor: Sixth consecutive year of 67M oz structural deficit with industrial demand consuming record 59% of supply from solar/EV/AI sectors remains fundamentally intact despite near-term price volatility driven by monetary policy headwinds and geopolitical uncertainty resolution
Additional influence: Managed money positioning at historically washed-out levels near 24k contracts after January-March liquidation cascade combined with SLV outflows decelerating creates positioning asymmetry where downside from forced liquidation limited but upside requires catalyst
Economic backdrop: Fed March 18 hawkish hold at 3.50-3.75% with ONE 2026 cut guidance drove real yields to 2.10%, March CPI released April 10 showed 3.3% YoY inflation spike from Iran war energy shock, next FOMC April 29 represents binary catalyst 17 days away
Fundamental assessment: Sixth consecutive year of 67M oz structural deficit with 59% industrial demand unchanged, supply inelastic at 820M oz mine production, China export restrictions controlling 60-70% supply operational since January 1 creating medium-term floor despite short-term monetary policy headwinds
Chart Assessment
Consolidating in $74-78 range after recovering from March 29 low of $69.77, price at $76.26 trading well above 200-day MA at $57 but 14% below 50-day MA at $87, RSI at 63 indicates healthy momentum without overbought conditions
With trend strength at 6/10, there's a clear directional tilt but room for the move to develop further.
Risk & Opportunity
Primary risk: Fed April 29-30 FOMC reinforces hawkish stance interpreting March 3.3% CPI as sustained inflation reacceleration rather than transitory energy shock, sustaining real yields above 2.0% and DXY above 105, triggering breakdown below $74 toward $70 support as remaining long positioning forced to capitulate (Probability: medium)
Primary opportunity: Iran war ceasefire holds and April CPI (released mid-month) shows inflation moderation as energy prices normalize, allowing Fed at April 29-30 FOMC to acknowledge March spike as transitory, weakening dollar below DXY 102 and driving real yields below 1.90%, enabling recovery toward $82-85 as washed-out institutional positioning and intact sixth-year deficit provide upside fuel (Timeframe: 2-4 weeks through April 29-30 FOMC if geopolitical tensions remain calm and inflation data cooperates)
This week's edge: Market treating Iran ceasefire as simple geopolitical risk-off signal weakening safe-haven demand, while desk recognizes the ceasefire resolves the primary driver of March CPI inflation shock (energy disruption) creating path for April inflation data to moderate and Fed dovish pivot at April 29 FOMC—sixth-year deficit with 59% industrial demand and washed-out institutional positioning at 24k contracts near 2-year lows creates asymmetric upside potential if monetary policy headwinds ease, though binary FOMC risk 17 days away caps conviction at 6
Volatility Backdrop
silver price is in a high-volatility environment (82th percentile over 90 days), where position sizing discipline becomes critical. Volatility remains anchored at current levels, with no clear signal of an imminent regime shift in either direction.
High volatility at 82nd percentile requires stops 12-18% below entry versus normal 4-6% with daily ranges now 5-7% versus typical 2-3%, making intraday swings volatile but directional conviction viable; breakout above $78.50 becomes reliable continuation signal toward $82-85 if sustained, while breakdown below $74 accelerates correction risk to $70-72
The Week Ahead
Federal Reserve April 29-30 FOMC meeting expected to hold rates unchanged at 3.50-3.75% with focus on forward guidance for remainder of 2026 and whether Fed acknowledges March inflation spike as transitory energy shock or sustained reacceleration on Wednesday 29 April is a high-impact catalyst with the potential to redefine the near-term outlook entirely.
How silver navigates the confluence of consolidating conditions and incoming data will determine whether the current directional thesis holds or breaks.
This analysis covers one dimension. Our full weekly report combines six specialist agents into a single actionable briefing with directional bias, key levels, and risk-opportunity matrix.
Start Free — Get the Market of the WeekFree weekly report · No credit card · Upgrade anytime


