Silver Forecast This Week — Outlook, Drivers & Key Levels
This week's Silver outlook: key drivers, volatility context, risk-opportunity assessment and the week ahead.

Where Things Stand
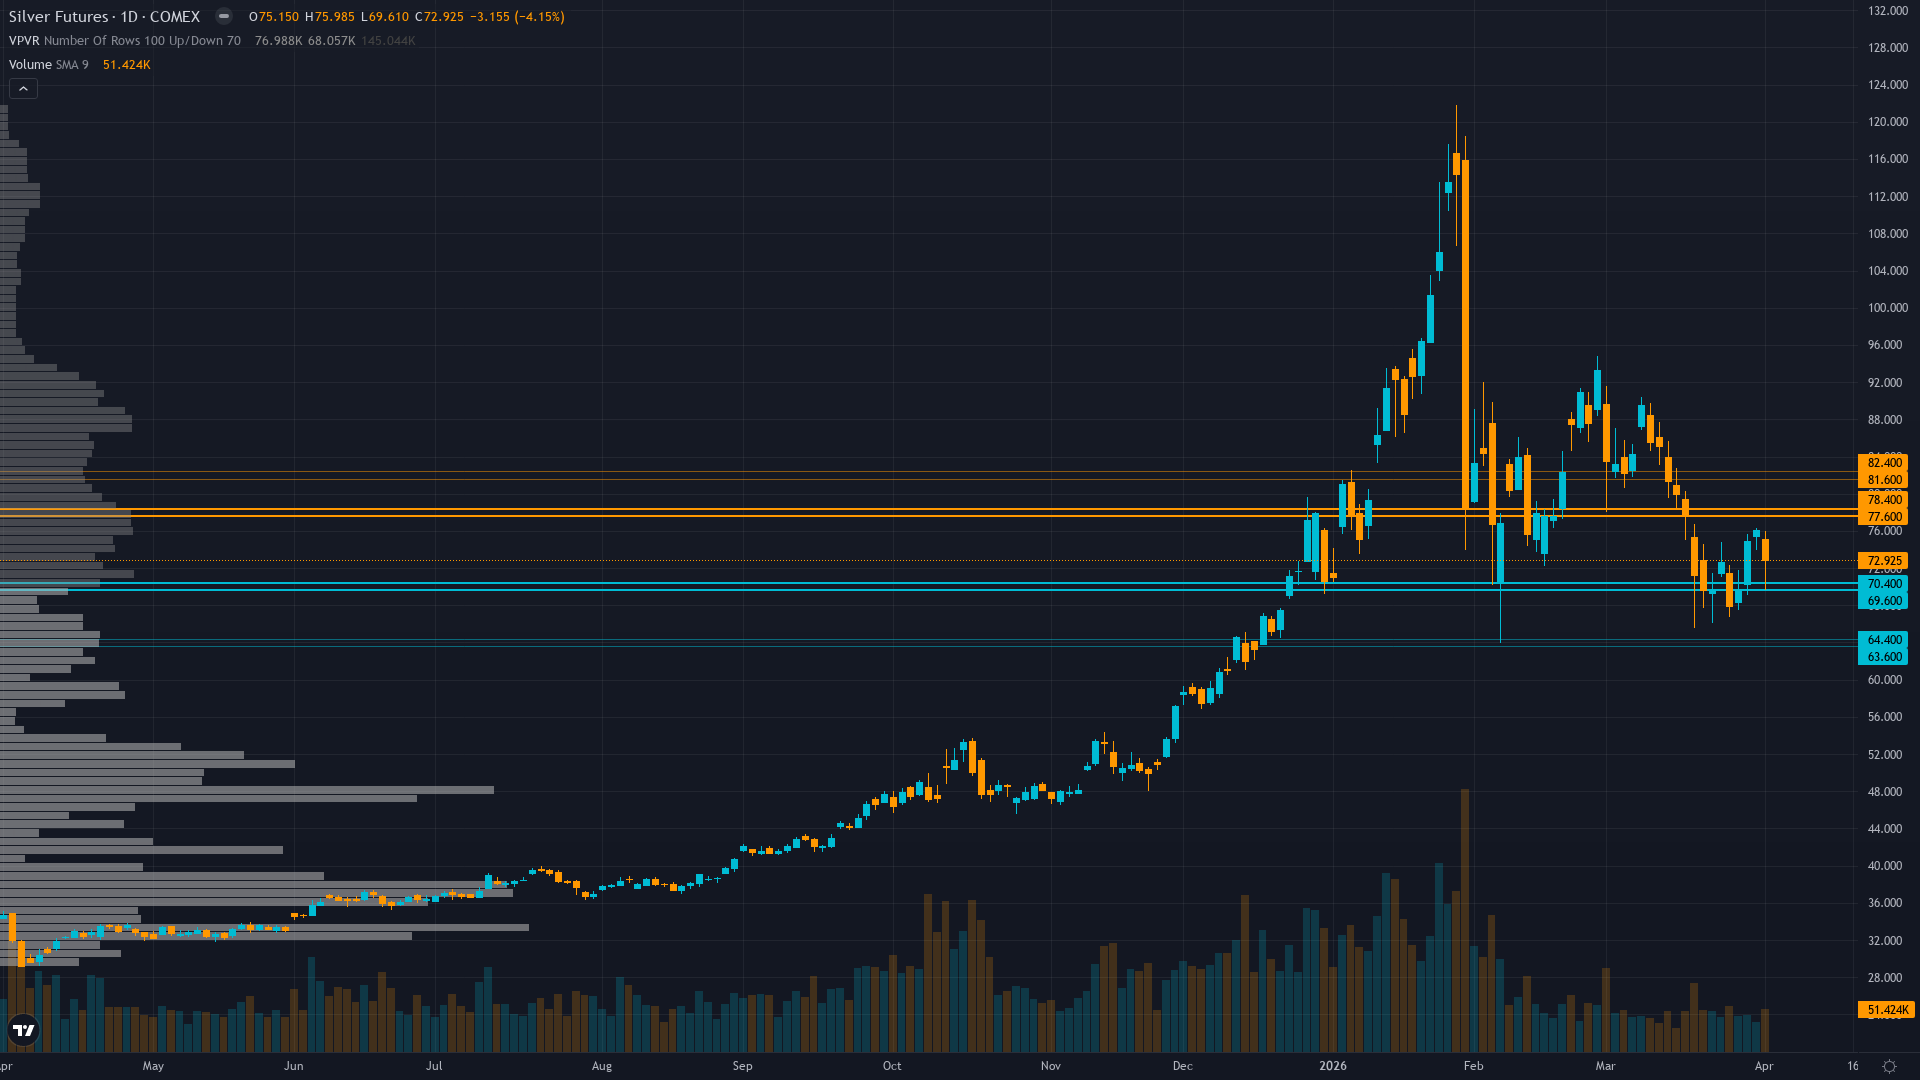
silver sits at 72.93, having shed 1.20% as bears maintain the upper hand. silver futures is consolidating, with price compressing into a narrower range as the market builds energy for its next move.
Market consensus fractured between structural bulls targeting $80-95 recovery by Q2 on intact deficit fundamentals and cautious bears projecting $60-70 extended consolidation on Fed restrictive policy, CoinCodex algorithm predicting +0.05% to $73.05 by April 11 suggests modest neutral-to-bullish lean emerging
What's Driving Price
Primary driver: Technical consolidation in $70-75 range following March 18 Fed hawkish hold, with structural fundamentals (sixth consecutive year of 67M oz deficit, 59% industrial demand) intact but overwhelmed near-term by real yields above 2.0% and DXY strength creating monetary policy headwinds
Secondary factor: Extreme volatility regime at 73-89th percentile (30-day IV 73.44% per Barchart April 2026 data) with daily 5-8% swings versus normal 2-3% creating two-way risk unsuitable for directional conviction despite successful defense of $70 psychological support zone
Additional influence: Neutral-to-bearish near-term sentiment with contrarian positioning overhang (90% retail long as of mid-March) facing technical deterioration below 50-day MA at $87.19, though washed-out institutional positioning (managed money at 22-24k contracts near 2-year lows) limits forced liquidation risk
Economic backdrop: Fed March 18-19 hawkish hold at 3.50-3.75% with ONE 2026 cut guidance drove 10Y TIPS real yields to 2.10% (34bp spike from pre-FOMC levels) and DXY above 100 creating perfect storm headwind for non-yielding precious metals, no material data releases this week April 1-5, next FOMC April 29-30 represents binary catalyst 24 days away
Fundamental assessment: Sixth consecutive year of 67M oz structural deficit (Silver Institute February 2026) with industrial demand consuming record 59% of supply from solar/EV/AI sectors unchanged, fundamentals constructive medium-term but overwhelmed near-term by monetary policy shock with real yields at 2.10% creating mathematical headwind for non-yielding assets
Chart Assessment
Consolidating in $70-76 range after March 29 low $69.77, successful defense of $70 psychological support critical validation though price remains 17% below 50-day MA at $87.19 representing overhead resistance, RSI neutral-weak at 41 suggesting consolidation not reversal, no bullish divergence yet visible
With trend strength at 4/10, the directional signal is present but far from decisive.
Risk & Opportunity
Primary risk: Fed April 29-30 FOMC reinforces hawkish stance with no rate cut signal for H1 2026, sustaining real yields above 2.0% and DXY above 105, triggering breakdown below $70 toward $64-67 support zone as remaining retail positioning (85-90% long per March data) forced to capitulate (Probability: medium)
Primary opportunity: Fed April FOMC signals dovish shift acknowledging inflation moderation or employment weakness, weakening dollar below DXY 102 and driving real yields back below 1.90%, enabling recovery toward $80-85 as washed-out institutional positioning (22k contracts near 2-year lows) and intact structural deficit provide upside fuel (Timeframe: 4-8 weeks if Fed pivots at April 29-30 meeting or subsequent data weakens sufficiently to force policy reconsideration by mid-May)
This week's edge: Market treating April 1-5 consolidation as extended correction requiring Fed pivot to resume uptrend, while desk recognizes successful $70 support defense as critical validation that sixth-year deficit with 59% industrial demand creates fundamental floor—however, extreme volatility at 89th percentile, absence of fresh catalysts this week, and binary FOMC risk 24 days away force neutral stance until thesis health restores or Fed provides directional clarity
Volatility Backdrop
silver price is in a high-volatility environment (89th percentile over 90 days), where position sizing discipline becomes critical. Volatility remains anchored at current levels, with no clear signal of an imminent regime shift in either direction.
Extreme volatility at 89th percentile requires stops 18-25% below entry versus normal 4-6% with daily ranges now 6-8% versus typical 2-3%, making directional calls highly unreliable for momentum strategies; breakout above $76.30 becomes reliable continuation signal toward $82-85 if sustained, while breakdown below $70 accelerates correction risk to $64-67 though structural deficit argues against sustained failure
The Week Ahead
Federal Reserve April 29-30 FOMC meeting expected to hold rates unchanged at 3.50-3.75% with focus on forward guidance for remainder of 2026 and whether Fed walks back March 18 hawkish ONE-cut projection or reinforces restrictive stance on Wednesday 29 April is a high-impact catalyst with the potential to redefine the near-term outlook entirely.
How silver navigates the confluence of consolidating conditions and incoming data will determine whether the current directional thesis holds or breaks.
This analysis covers one dimension. Our full weekly report combines six specialist agents into a single actionable briefing with directional bias, key levels, and risk-opportunity matrix.
Start Free — Get the Market of the WeekFree weekly report · No credit card · Upgrade anytime


