Russell 2000 Key Levels This Week — Support, Resistance & Confluence Zones
Russell 2000 key levels breakdown: support zones, resistance zones, confluence and price structure.

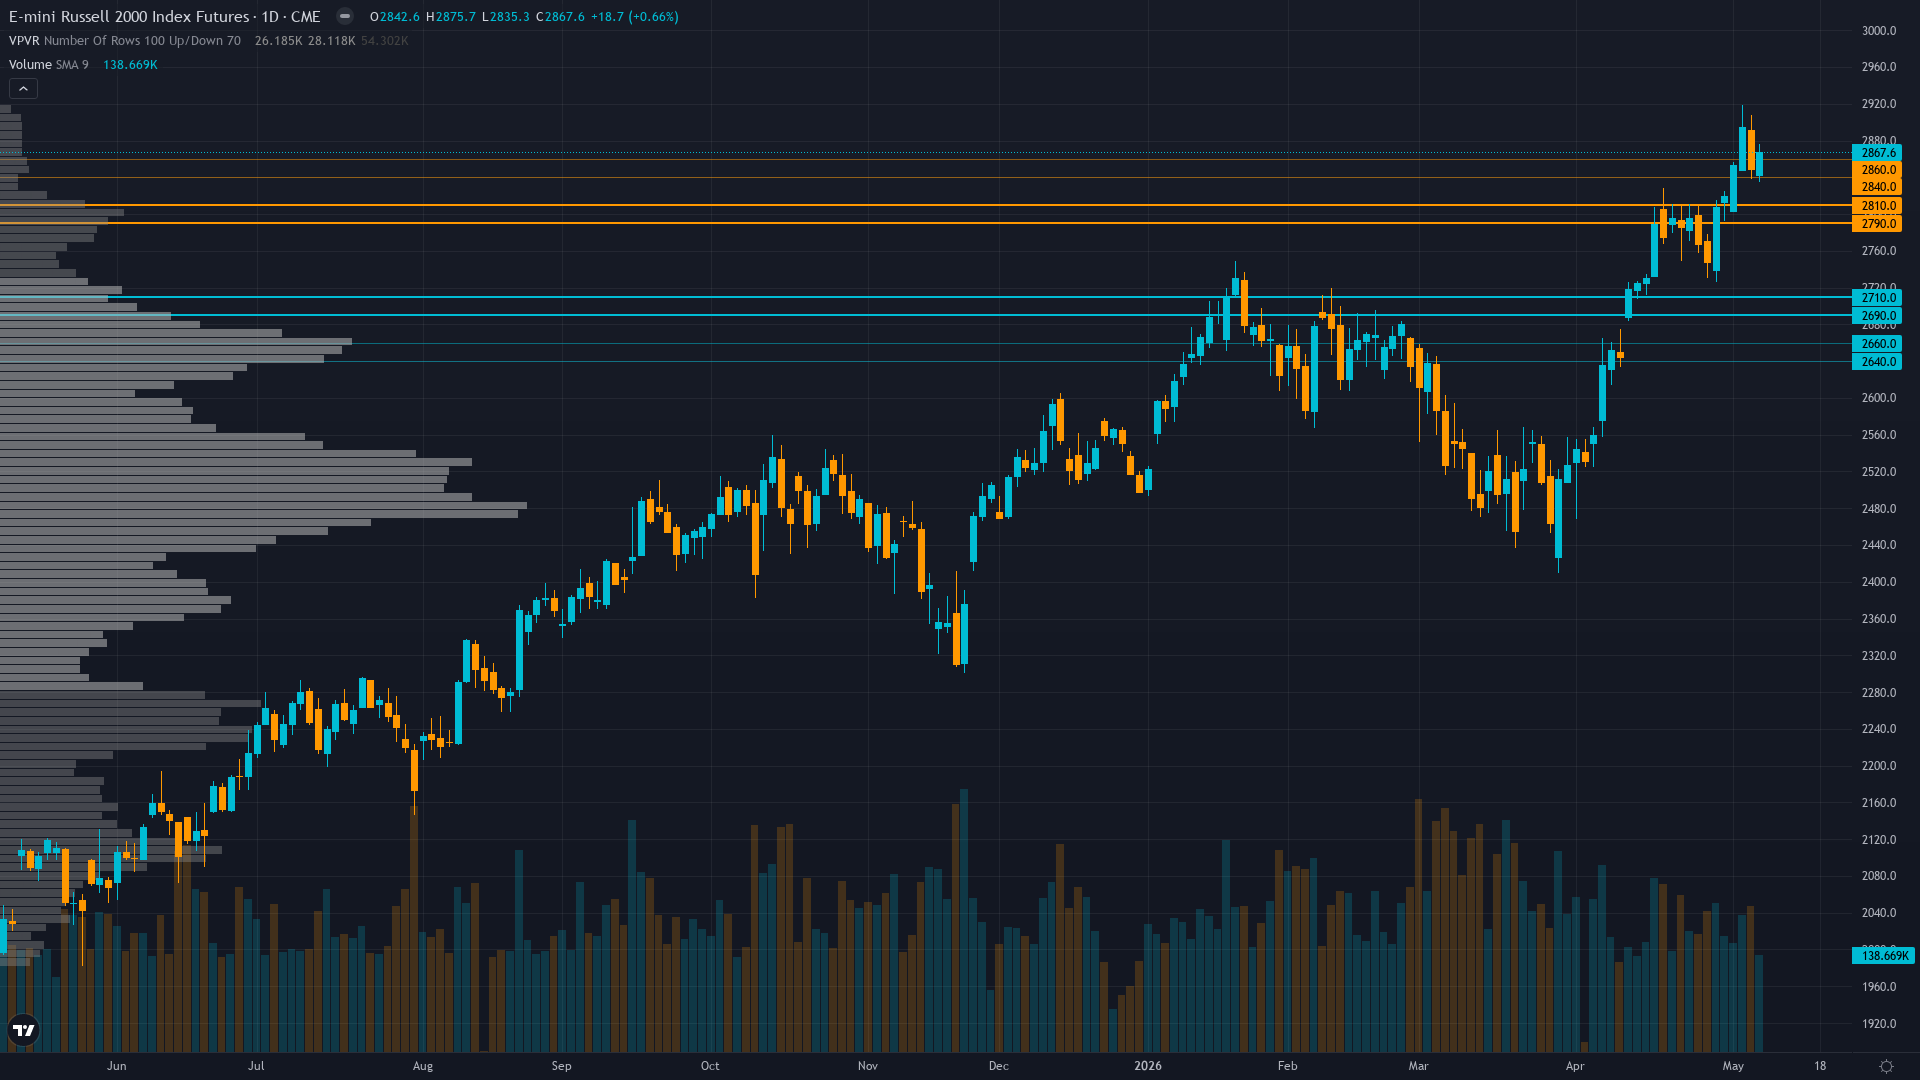
Current Price Structure
Russell 2000 stands at 2898.9, having rallied 1.78% as bulls press their advantage. Russell 2000 futures is in a breaking out market state, requiring careful assessment of current conditions.
Strong uptrend confirmed with fresh ATH at 2899.30 on May 10, price trading 16% above 50-day MA at 2492 and 13% above 200-day MA at 2564, technical indicators showing 'Strong Buy' signals
Trend strength registers 8/10 — a reading that suggests the directional impulse has real staying power.
Support Zone Context
Below the current level, small-cap futures has structural support where demand has historically stepped in. The reliability of these zones depends on the volume profile and the number of prior interactions.
In the current trending up environment, support zones carry standard probability of reaction.
Ceilings & Supply Zones
Above current price, Russell 2000 futures faces resistance zones where selling pressure has historically intensified. These levels represent previous supply zones, profit-taking areas, or structural barriers that price needs to overcome for continuation.
How firmly these zones hold depends on the confluence of volume, prior reactions, and the current market regime.
Where Disciplines Converge
For small-cap futures, the levels that matter most are those confirmed by independent analytical approaches. When six different disciplines identify the same zone, the signal-to-noise ratio improves dramatically.
Normal volatility regime at 58th percentile supports standard risk management with 2-3% stops below 2800 support, expect 40-60 point daily ranges versus 60-100 during March correction, stable pattern suggests directional trending environment favorable for continuation
How Macro Agent Desk Identifies Key Levels
Macro Agent Desk identifies key levels through a six-agent process. Each analytical discipline contributes independently — technical for structure, institutional for smart money interest, options for hedging activity, fundamentals for fair value context, sentiment for crowd positioning, and economics for catalyst timing.
What this means in practice: every key level in the full weekly report has been stress-tested across multiple independent analytical frameworks before it reaches the page.
Our paid reports include specific support and resistance levels identified by six specialist agents — technical structure, institutional positioning, options flow, fundamentals, sentiment, and economic analysis. Not just lines on a chart, but zones validated by multi-discipline confluence.
Start Free — Get the Market of the WeekFree weekly report · No credit card · Upgrade anytime


