Russell 2000 Forecast This Week — Outlook, Drivers & Key Levels
This week's Russell 2000 outlook: key drivers, volatility context, risk-opportunity assessment and the week ahead.

Where Things Stand
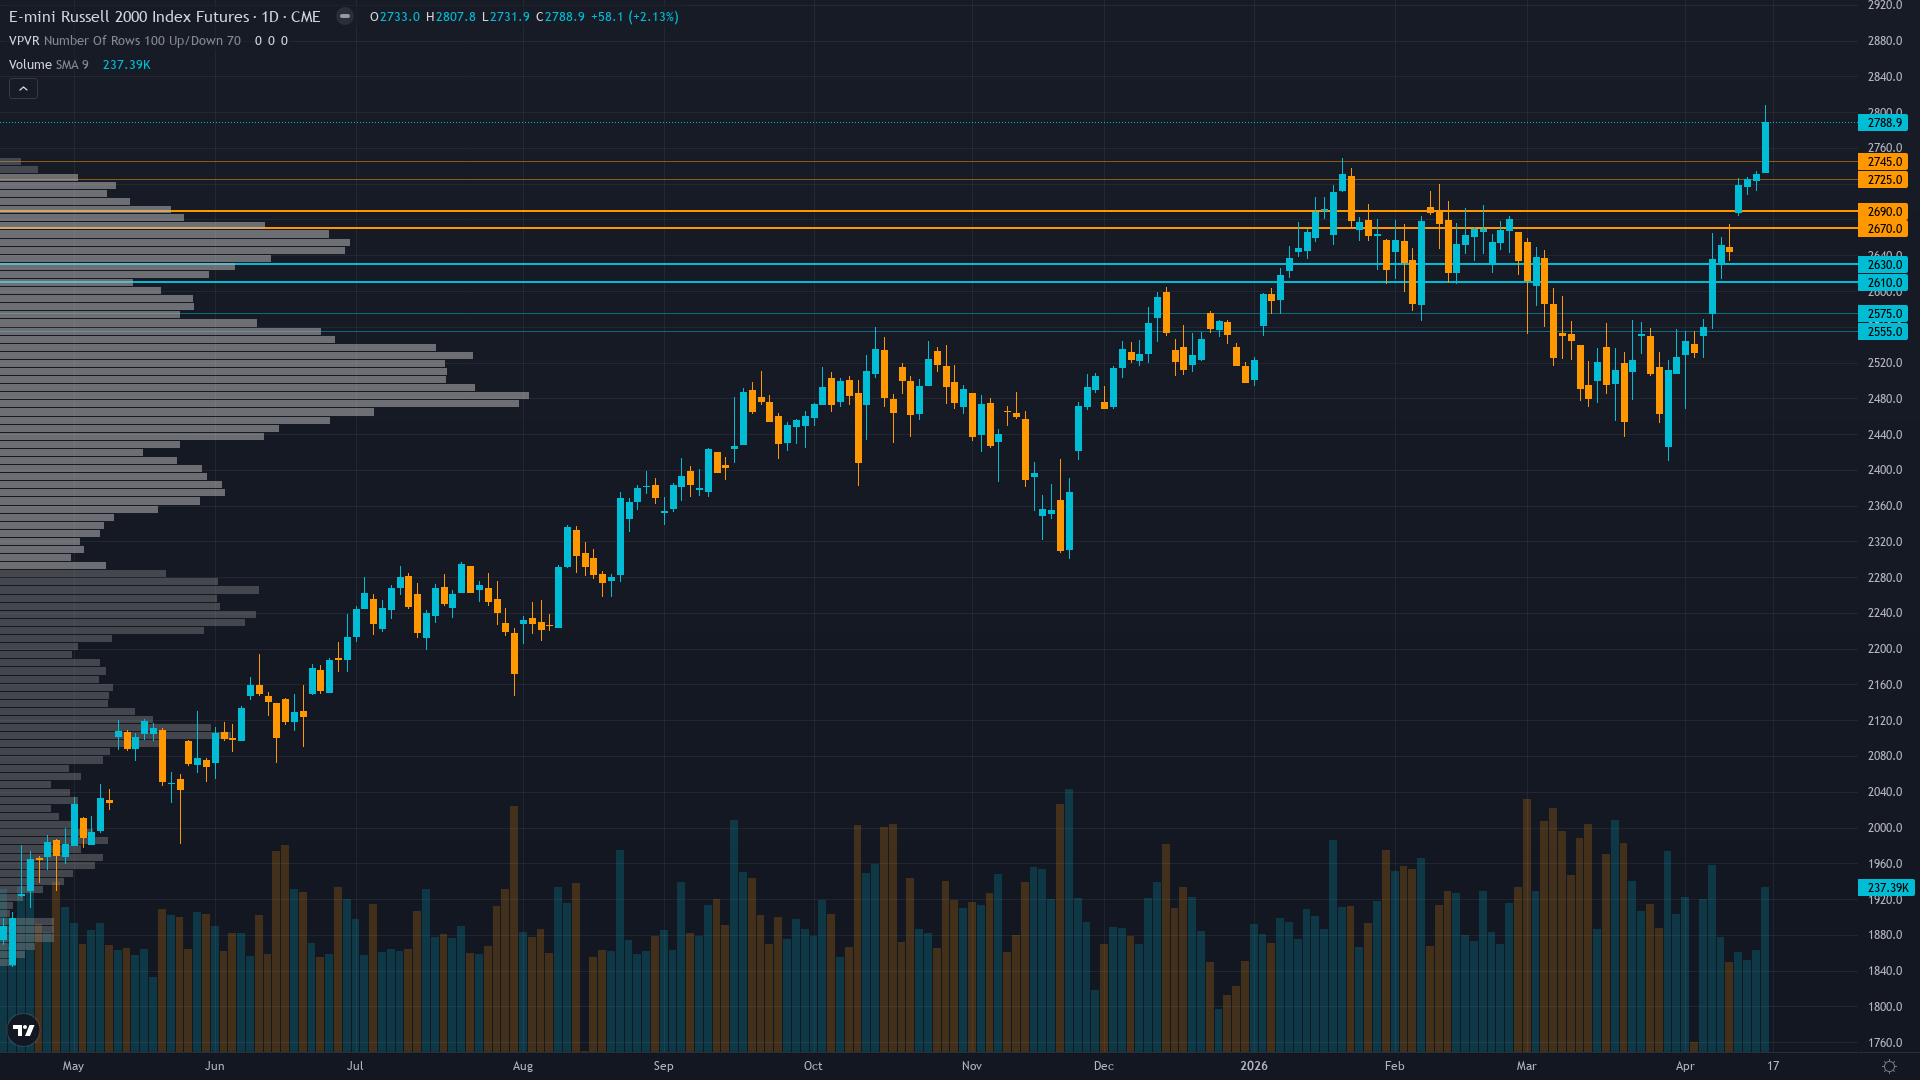
At 2713.1, Russell 2000 has gained 2.35% over the past session with buying pressure clearly in the driving seat. Russell 2000 futures is in a trending up market state, requiring careful assessment of current conditions.
Small-caps extending 'Great Rotation' narrative with fresh April 17 ATH at 2797.1 validating breakout, Q1 earnings season underway to test 44.9% growth consensus, market positioned for continued outperformance
What's Driving Price
Primary driver: Post-input development identified: New all-time high at 2797.1 on April 17, 2026 (2 days ago), extending the small-cap rally by 2.9% beyond prior January ATH of 2735, validating continuation of sentiment-driven momentum
Secondary factor: VIX normalization to 17.28-18.18 range from March correction spike confirms sustained risk-on regime, creating favorable macro environment for credit-sensitive small-caps as fear premium dissipates
Additional influence: Q1 2026 earnings season underway with 44.9% YoY growth consensus providing imminent fundamental validation catalyst, though April 28-29 FOMC approaching creates policy uncertainty headwind
Economic backdrop: RISK-ON macro regime with Fed on hold at 3.50-3.75% ahead of April 28-29 FOMC (9 days away), VIX below 20, no fresh economic data surprises in past week, market pricing 99% probability of hold
Fundamental assessment: Q1 2026 earnings season in progress testing 44.9% YoY growth consensus, but elevated forward P/E at 25.39 versus 13.62-17.34 historical range creates valuation vulnerability to earnings delivery risk
Chart Assessment
Strong uptrend confirmed with price at 2713 above 50-day MA at 2492 and 200-day MA at 2564, fresh ATH breakout to 2797.1 on April 17 validates bullish structure with consolidation 3% below peak
Trend strength registers 8/10 — a reading that suggests the directional impulse has real staying power.
Risk & Opportunity
Primary risk: Q1 earnings season delivers materially below 44.9% YoY growth consensus triggering multiple compression from elevated 25.39x forward P/E, particularly if April 28-29 FOMC delivers hawkish surprise removing easing hopes (Probability: medium)
Primary opportunity: Continuation rally targeting 2800+ as April 17 new ATH at 2797.1 validates breakout structure, with Q1 earnings season providing fundamental validation opportunity and short squeeze potential from heavy spec shorts (Timeframe: 1-3 weeks through April 28-29 FOMC and ongoing Q1 earnings releases)
This week's edge: Market consensus celebrating fresh ATH may be underpricing sentiment complacency risk (VIX 17-18, put/call 0.41 at extremes) and earnings delivery vulnerability on elevated 44.9% bar, while desk sees tactical continuation into FOMC but recognizes 3-week winning streak and bias review threshold create heightened reversal risk requiring close monitoring
Volatility Backdrop
RTY futures volatility at the 58th percentile reflects a balanced environment where standard risk parameters apply. Volatility remains anchored at current levels, with no clear signal of an imminent regime shift in either direction.
Normal volatility regime at 58th percentile supports standard risk management with 3-4% stops below 2565 support, expect 40-60 point daily ranges versus 60-100 during March correction, stable pattern suggests directional trending environment
Historical Seasonal Bias
Seasonal analysis shows a historically bullish bias for small-cap futures in April 2026, with a 60% win rate. Q2 start often sees risk-on rotation.
What to Watch
The Federal Reserve FOMC Meeting April 28-29 with forward guidance critical for small-cap trajectory given rate sensitivity of Russell 2000 constituents and refinancing wall concerns on Tuesday 28 April stands as the week's primary risk event — high-impact and capable of overriding the existing technical and sentiment setup.
The interplay between trending up market conditions and upcoming catalysts will define this week's trading landscape for Russell index.
This analysis covers one dimension. Our full weekly report combines six specialist agents into a single actionable briefing with directional bias, key levels, and risk-opportunity matrix.
Start Free — Get the Market of the WeekFree weekly report · No credit card · Upgrade anytime


