Russell 2000 Forecast This Week — Outlook, Drivers & Key Levels
This week's Russell 2000 outlook: key drivers, volatility context, risk-opportunity assessment and the week ahead.

This Week's Starting Point
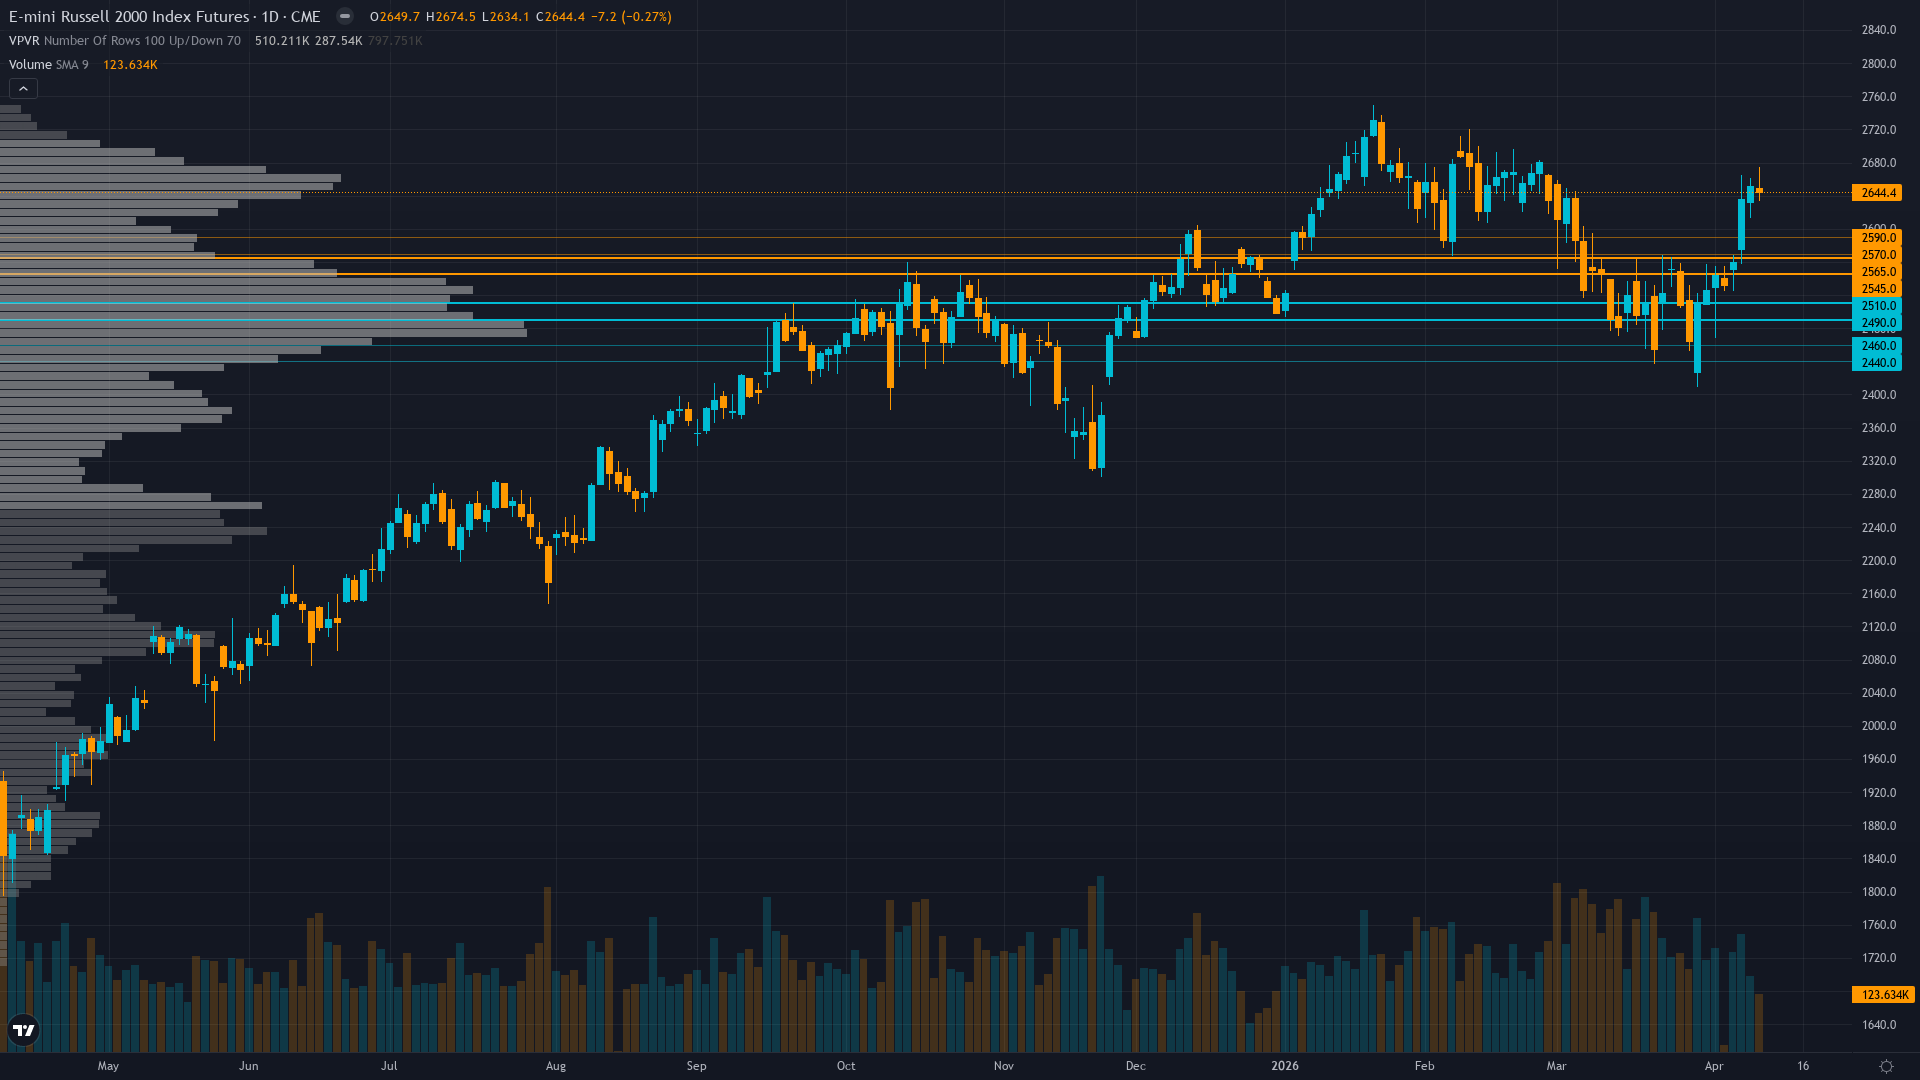
Trading at 2650 after a 4.45% move higher, Russell 2000 continues to attract buying interest. Russell 2000 futures is in a trending up market state, requiring careful assessment of current conditions.
Small-caps in 'Great Rotation' momentum with IWM surging 12%+ and Q1 earnings season beginning mid-April to test 44.9% growth consensus, but near-term caution warranted on hot CPI removing Fed easing catalyst
Forces in Play
Primary driver: VIX collapse from 23.87 to 19.23 over past week creating risk-on environment as fear recedes, combining with last week's 4.45% RTY surge validating sentiment-driven bounce thesis
Secondary factor: Q1 2026 earnings season begins mid-April (within days) with 44.9% YoY growth consensus providing fundamental catalyst to validate small-cap rotation narrative after January ATH breakout
Additional influence: Hot March CPI (+1.1% MoM, +3.1% YoY) removes near-term Fed easing catalyst but market has absorbed shock, with credit spreads tightening to 3.17% signaling underlying stability
Economic backdrop: Fed on hold at 3.50-3.75% with April 28-29 FOMC 16 days away, March CPI hot at +1.1% MoM removes easing hopes but transitional macro regime with VIX below 20 and credit spreads tightening
Fundamental assessment: Q4 2025 earnings inflection real at 64.9% growth with Q1 2026 projecting 44.9% YoY, but forward P/E at 25.4 versus 13.62-17.34 historical range creates valuation sensitivity to earnings delivery
Technical Landscape
Uptrend intact above 50-day MA at 2,296 and 200-day at 2,190, price at 2,650 pulled back 3.1% from January 22 ATH of 2,735 but holding constructive structure
Trend strength registers at 7/10, suggesting meaningful but not extreme directional bias.
Risk-Reward Assessment
Primary risk: Q1 earnings season delivers materially below 44.9% YoY growth consensus triggering multiple compression from elevated 25.4x forward P/E, particularly if margin pressures from hot CPI data materialize in results (Probability: medium)
Primary opportunity: Continuation of sentiment-driven rally from improved VIX regime (19.23 vs 24-27 last week) targeting 2,680-2,735 resistance as Q1 earnings validate 44.9% growth inflection and short squeeze accelerates from heavy spec short positioning (Timeframe: 1-3 weeks into early Q1 earnings releases and FOMC meeting April 28-29)
This week's edge: Market consensus focused on 'Great Rotation' narrative may be underpricing earnings delivery risk on elevated 44.9% bar, while desk sees tactical continuation of sentiment-driven bounce into earnings with conviction backed by last week's CORRECT call and VIX normalization to 19.23
Risk Environment
With vol at the 58th percentile over 90 days, RTY futures is in a measured regime that doesn't require unusual adjustments. Volatility is stable, with realised vol holding steady across timeframes. This equilibrium can persist but eventually resolves into expansion or contraction.
Normal volatility regime at 58th percentile supports standard risk management with 3-4% stops below 2,565 support, expect 40-60 point daily ranges versus 60-100 during March correction, normalization pattern suggests directional trending rather than range-bound chop
Seasonal Context
Historically, April 2026 has favoured the upside for small-cap futures (60% win rate). Q2 start often sees risk-on rotation.
Week Ahead Outlook
The next major catalyst is Q1 2026 earnings season begins for Russell 2000 constituents, testing 44.9% YoY growth consensus through mid-May with majority of results by late April on Tuesday 14 April — a high-impact event that could materially shift the directional picture.
For Russell 2000, the balance between existing momentum and scheduled risk events sets the stage for the week ahead.
This analysis covers one dimension. Our full weekly report combines six specialist agents into a single actionable briefing with directional bias, key levels, and risk-opportunity matrix.
Start Free — Get the Market of the WeekFree weekly report · No credit card · Upgrade anytime


