Russell 2000 Forecast This Week — Outlook, Drivers & Key Levels
This week's Russell 2000 outlook: key drivers, volatility context, risk-opportunity assessment and the week ahead.

Current Market Picture
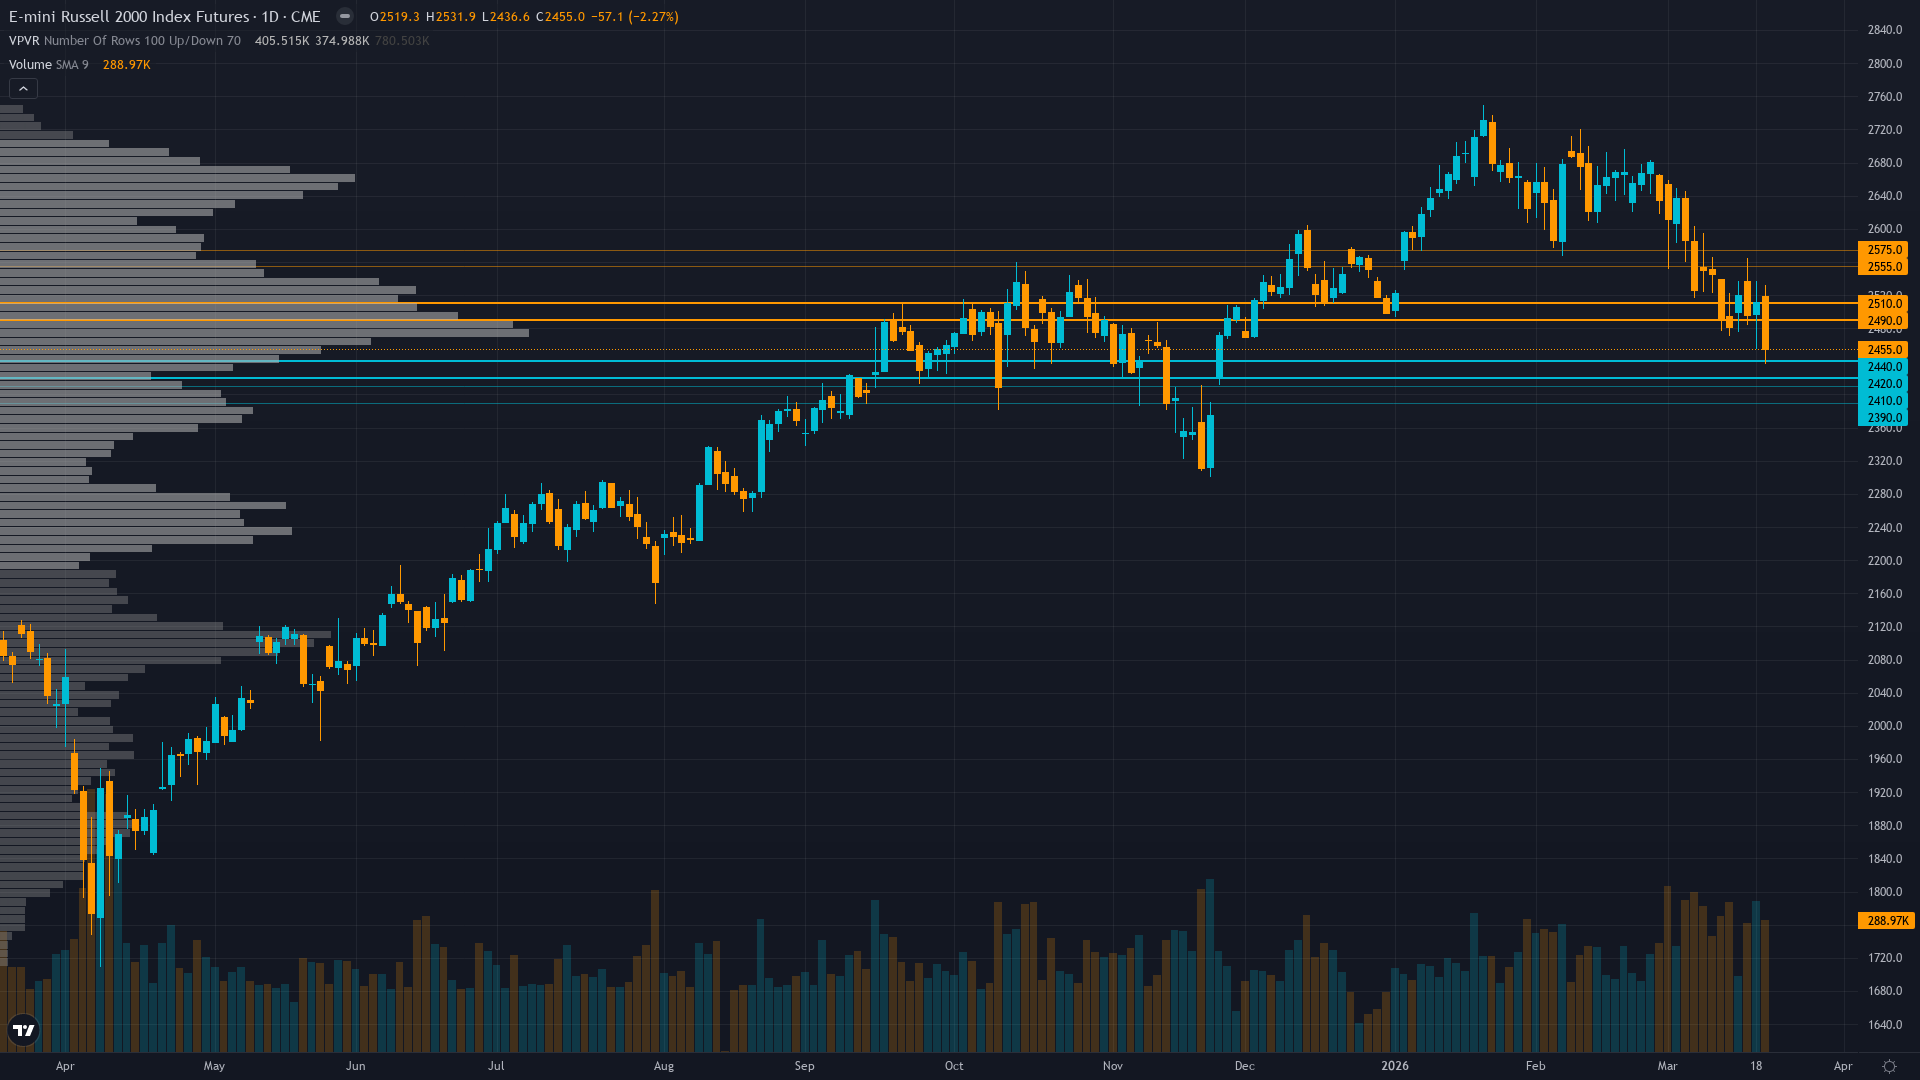
Russell 2000 fell to 2455 on a 1.47% decline, with selling pressure dominating price action. Russell 2000 futures is in a breaking down market state, requiring careful assessment of current conditions.
Small-caps under severe pressure from FOMC hawkish pivot removing easing catalyst, but retaining fundamental appeal from 17-22% earnings growth outlook once volatility settles and Fed clarity emerges
Key Drivers This Week
Primary driver: March 18 FOMC held rates at 3.5-3.75% with hawkish dot plot raising long-run rate expectations to 3.1%, triggering equity selloff with small-caps bearing brunt as credit-sensitive asset class
Secondary factor: RTY officially entered correction territory March 20 at -10.2% from January 22 ATH of 2735, first major U.S. benchmark to do so in 2026, confirming breakdown structure
Additional influence: Contrarian bullish setup emerging with VIX 26.78 above fear threshold, AAII bears at 52% creating sentiment extreme, but oversold RSI 31.52 has yet to show bullish divergence
Economic backdrop: RISK-OFF macro regime: Fed March 18 held at 3.5-3.75% with 7 of 19 FOMC members expecting no cuts in 2026 versus prior 2-cut consensus, removing small-cap easing catalyst
Fundamental assessment: Q4 2025 earnings inflection real at 64.9% Y/Y growth with 17-22% 2026 outlook, but valuation premium at 19-25x forward P/E versus 13.62-17.34x historical range creates vulnerability
Price Structure
Confirmed downtrend 10.2% below January ATH, price at 2455 testing critical 2430-2450 support zone with RSI 31.52 oversold but no divergence yet
Trend strength registers just 3/10, which typically corresponds to choppy, directionless price action.
Upside & Downside
Primary risk: Failure of 2430-2450 support zone triggering algorithmic cascade toward 2400 major support representing additional 2-3% decline, potentially accelerating to 2300 if credit spreads widen materially (Probability: medium)
Primary opportunity: Technical bounce from oversold RSI 31.52 and sentiment extreme (VIX 26.78, AAII bears 52%) targeting 2500-2520 resistance as counter-trend relief rally, though structural headwinds remain intact until Fed provides easing clarity (Timeframe: 3-7 days if 2430-2450 support holds into ISM data April 1)
This week's edge: Market may be overpricing breakdown risk given VIX 26.78 fear extreme and AAII 52% bears creating contrarian setup at oversold RSI 31.52, but desk assesses bearish lean as highest probability until 2430-2450 support validates or FOMC rhetoric softens in coming weeks
Volatility Context
At the 68th percentile, RTY futures volatility sits in a normal range, neither compressed enough to signal a breakout nor elevated enough to demand caution. Realised vol is trending higher across the curve, which tends to accompany transitional periods where the market is repricing risk.
Elevated volatility regime requires wider stops at 5-6% below 2400 major support, expect 60-100 point daily ranges versus 40-60 normal, breakdown combined with vol expansion suggests highly directional environment favoring trend-following over mean-reversion until capitulation signals emerge
Seasonal Patterns
Seasonality is a non-factor for small-cap futures this month, with a 52% historical win rate offering no edge. Quarter-end rebalancing can create volatility.
Looking Forward
All eyes turn to ISM Manufacturing PMI for March 2026 at 10:00 AM ET, critical test of economic momentum following February 52.4 reading on Wednesday 1 April, which carries enough weight to force a decisive directional move.
The week ahead for RTY futures hinges on whether the prevailing breaking down regime can absorb the scheduled catalysts without a regime shift.
This analysis covers one dimension. Our full weekly report combines six specialist agents into a single actionable briefing with directional bias, key levels, and risk-opportunity matrix.
Start Free — Get the Market of the WeekFree weekly report · No credit card · Upgrade anytime


