Russell 2000 Forecast This Week — Outlook, Drivers & Key Levels
This week's Russell 2000 outlook: key drivers, volatility context, risk-opportunity assessment and the week ahead.

Market Overview
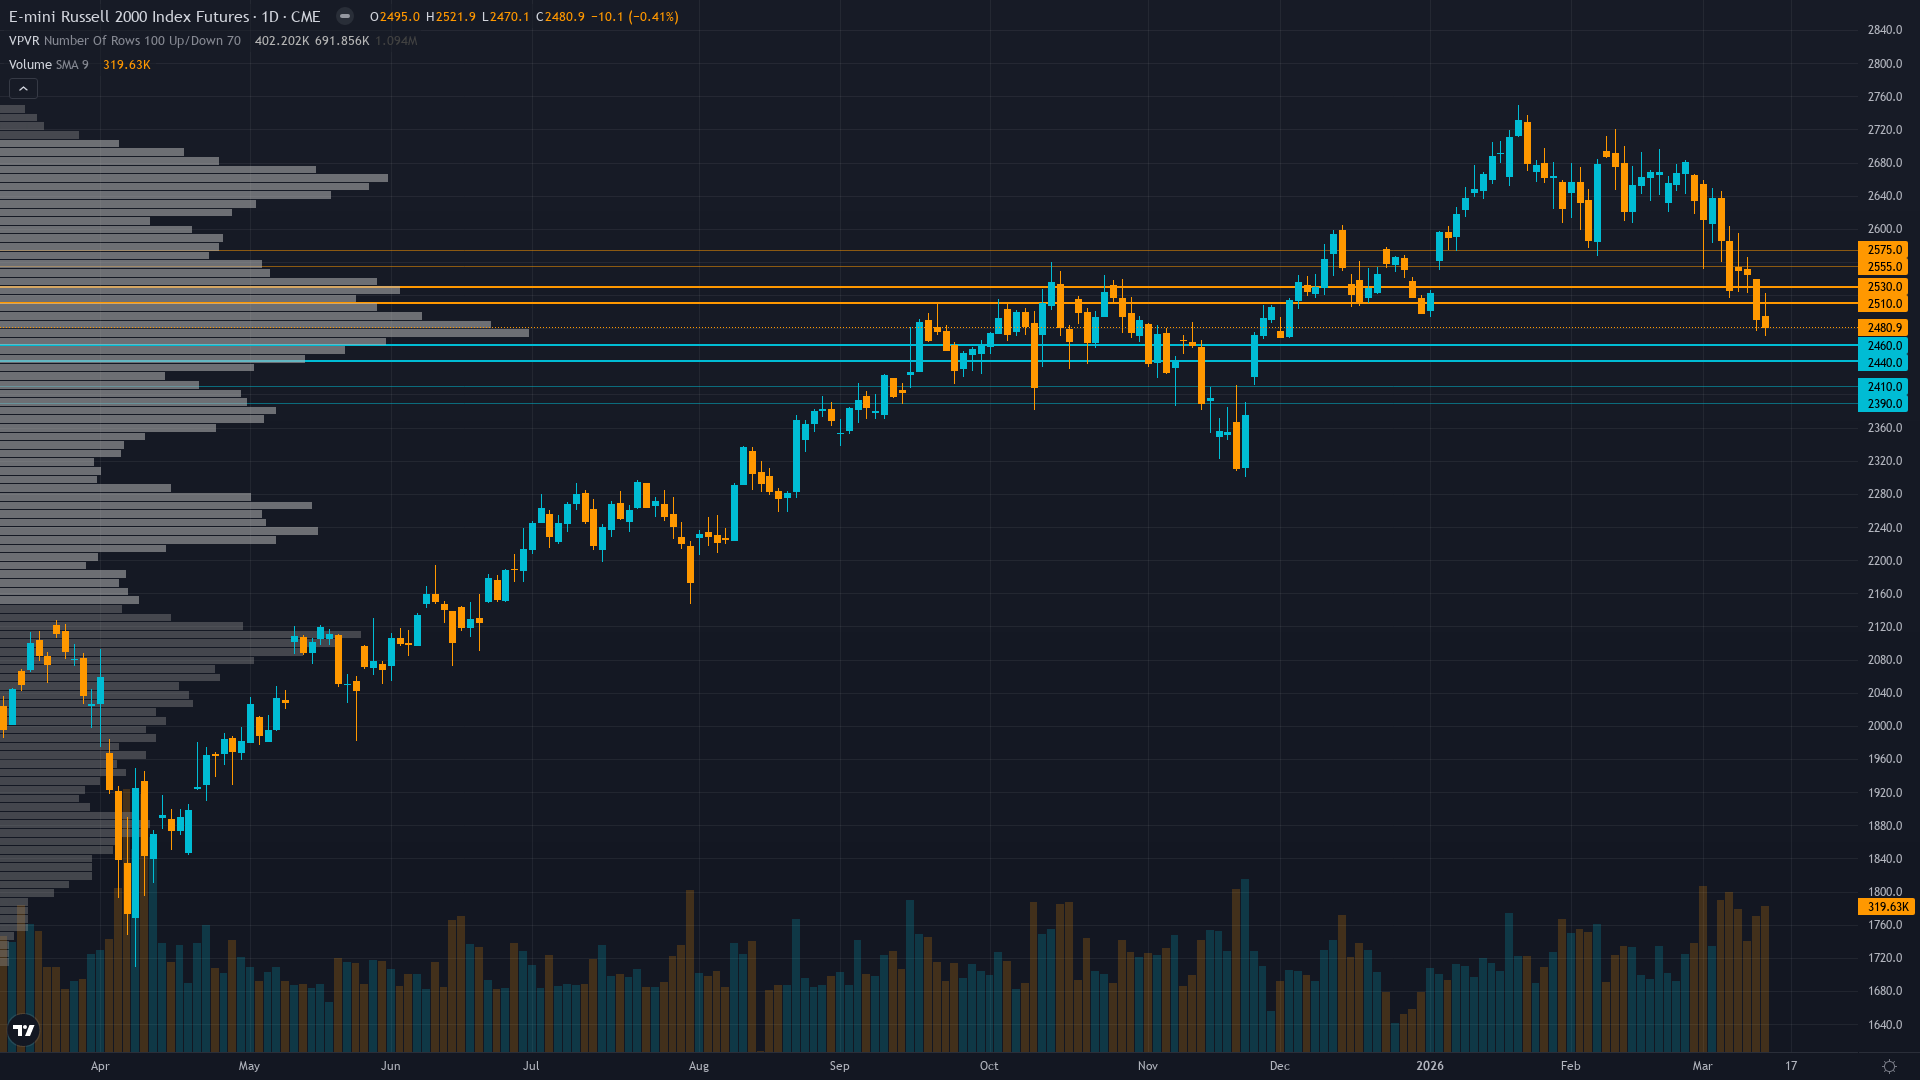
Trading at 2491.6 with a 0.46% dip, Russell 2000 is giving back ground gradually. Russell 2000 futures is in a breaking down market state, requiring careful assessment of current conditions.
Small-caps under pressure from risk-off dynamics and Fed uncertainty but retaining fundamental appeal from earnings growth once volatility settles
This Week's Catalysts & Drivers
Primary driver: RISK-OFF regime with VIX at 27.19 creating acute pressure on credit-sensitive small-caps 8.9% below January ATH as FOMC meeting March 19 looms
Secondary factor: Sustained institutional liquidation with IWM ETF bleeding -$2.8B in just 5 days signaling accelerating selling pressure rather than capitulation
Additional influence: Technical breakdown confirmed below 2500 with RSI 31.52 oversold but no bullish divergence yet to signal reversal
Economic backdrop: Fed on hold at 4.25-4.50% with 92%+ probability of no cut March 19, transitional regime with 30-35% recession probability creating policy uncertainty
Fundamental assessment: Strong earnings inflection (64.9% Q4 growth) offset by valuation premium at 19-25x forward P/E versus historical 13.62-17.34x range
Technical Picture
Confirmed downtrend 6% below both 50/200-day MAs at 2,641, RSI 31.52 oversold without divergence, testing critical 2450 support
At 3/10, trend strength is subdued, suggesting the market lacks a clear directional mandate.
Bull & Bear Case
Primary risk: FOMC confirms extended pause or signals hawkish tilt combining with failure to hold 2450 support triggering algorithmic cascade toward 2400 major support representing additional 2-3% decline (Probability: medium)
Primary opportunity: Technical bounce from oversold RSI 31.52 if 2450 holds into FOMC, targeting 2520 resistance as short-term relief, though structural headwinds remain intact (Timeframe: 3-5 days into March 19 FOMC decision)
This week's edge: Market may be underpricing oversold bounce potential from RSI 31.52 and fear sentiment while overweighting breakdown risk, though desk assesses neutral/slight bearish as highest probability given FOMC uncertainty and lack of capitulation signals
Volatility Regime
Volatility for RTY futures is at the 62th percentile over 90 days — a normal regime that allows for standard position sizing and conventional trade management. The volatility trend is up, with expansion across timeframes pointing to growing uncertainty in near-term price action.
Elevated volatility regime requires wider stops at 4-5% below 2400 support, expect 60-100 point daily ranges versus 40-60 normal, breakdown combined with vol expansion suggests directional environment favoring trend-following
What History Shows
small-cap futures enters March 2026 without a meaningful seasonal lean (52% win rate). Quarter-end rebalancing can create volatility.
The Week Ahead
FOMC Meeting with 92%+ probability of hold at 3.50-3.75% per CME FedWatch, forward guidance critical for small-cap trajectory on Thursday 19 March is a high-impact catalyst with the potential to redefine the near-term outlook entirely.
How Russell 2000 futures navigates the confluence of breaking down conditions and incoming data will determine whether the current directional thesis holds or breaks.
This analysis covers one dimension. Our full weekly report combines six specialist agents into a single actionable briefing with directional bias, key levels, and risk-opportunity matrix.
Start Free — Get the Market of the WeekFree weekly report · No credit card · Upgrade anytime


