Russell 2000 COT & Institutional Positioning — Smart Money Analysis
Russell 2000 institutional positioning: COT data, sentiment analysis and smart money flow assessment.

Where Institutions Stand
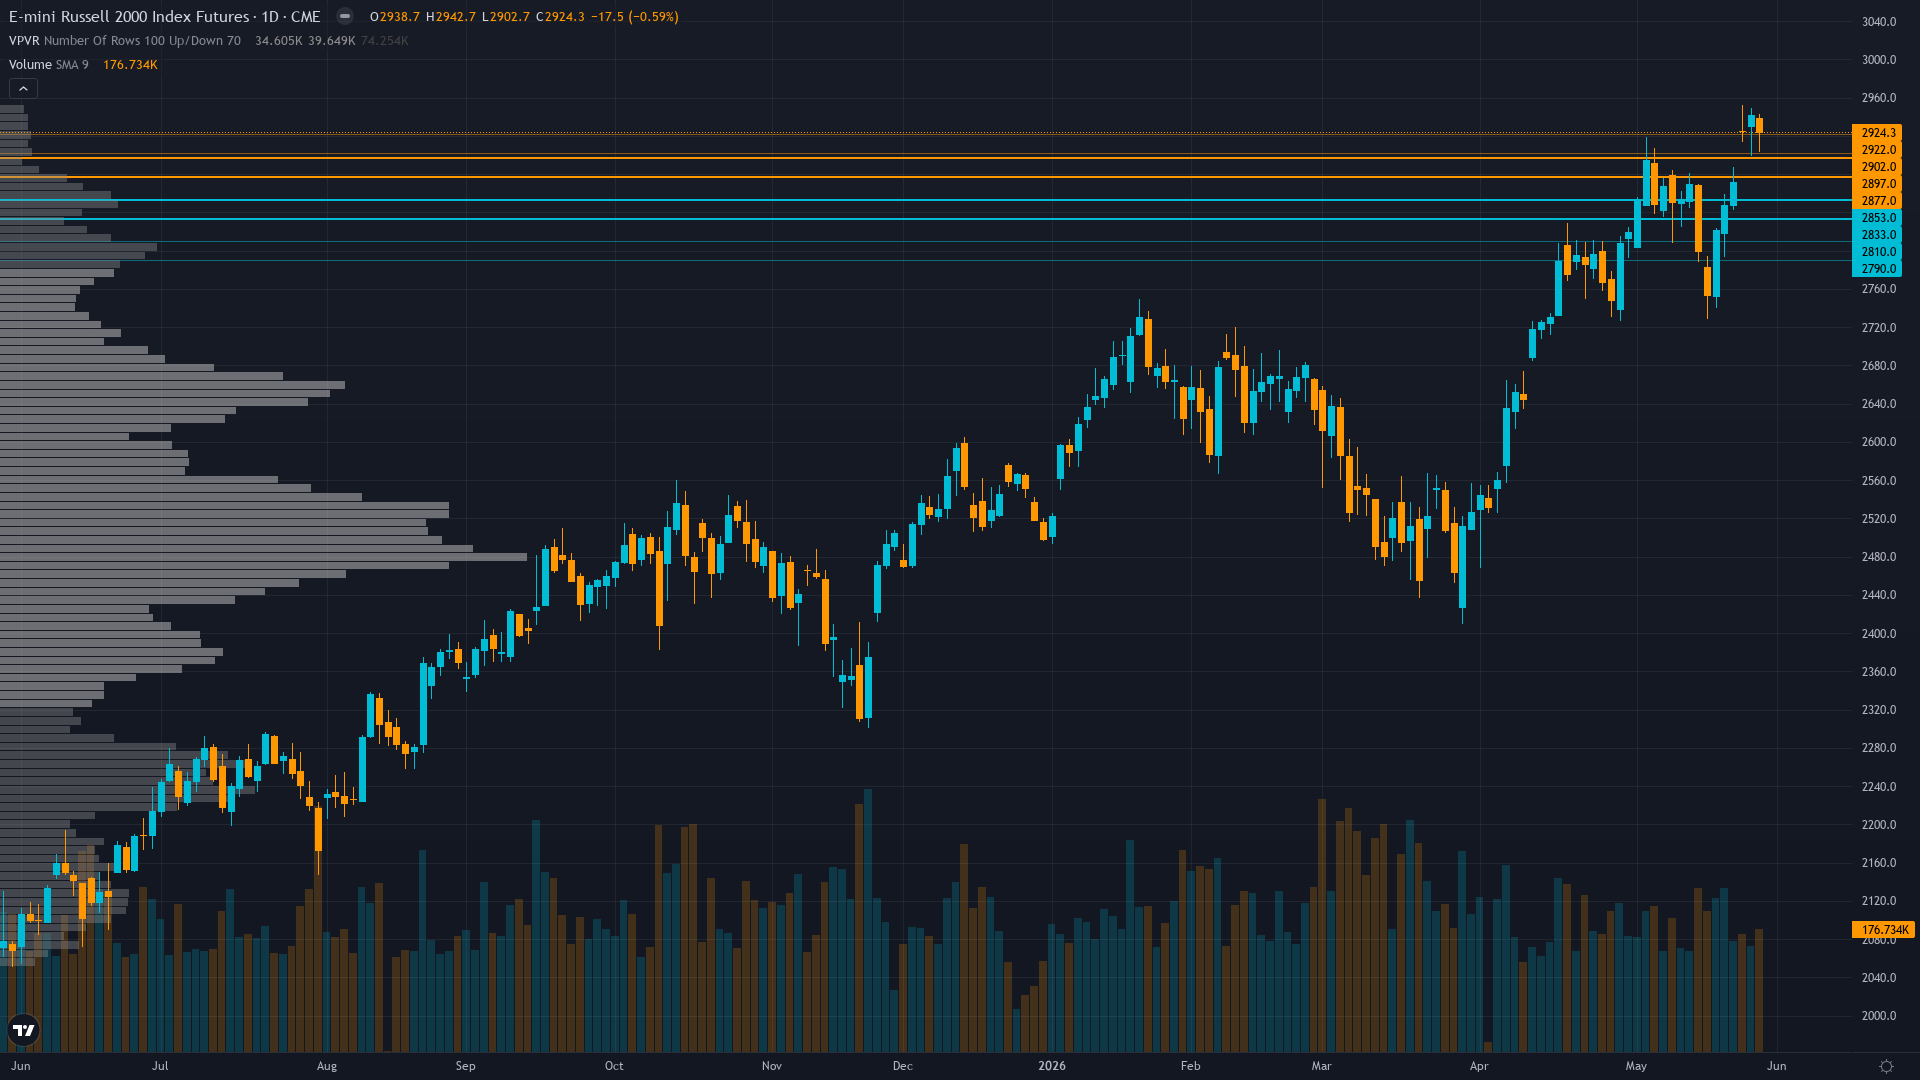
At 2905.3, Russell 2000 has inched 0.18% higher in a measured advance.
Mixed signals with IWM showing recent +$4.31B 5-day inflows reversing prior year-long -$7.41B outflow trend, but stale February COT data limits conviction, Russell reconstitution 4 weeks away (late June) creates potential forced flow catalyst
Consensus vs MAD View
Market consensus: Small-caps consolidating near May 6 all-time high at 2912.0 with market positioned for June 17-18 FOMC to provide rate path clarity, maintaining constructive outlook on Q1 earnings validation and benign volatility environment supporting equity grind higher
Primary driver: Post-input development identified: RTY trading at 2905.30 on May 31, 2026 consolidating just 0.2% below May 6 all-time high of 2912.0, creating constructive consolidation structure near record levels following four consecutive missed graded calls requiring heightened analytical discipline
Where the Crowd May Be Wrong
Desk neutral stance after 4 consecutive misses aligns with prudent risk management but all 6 disciplines show bullish leans and market positioned for continuation near ATH, creating low divergence as desk acknowledges miss streak override requires reset rather than identifying underpriced factor
Crowd Psychology
Neither side has committed heavily to Russell 2000 futures, leaving sentiment in a neutral zone that offers little directional guidance on its own.
Options Flow
VIX at 15.32 near 52-week low of 13.38 with equity put/call at extreme 0.39 showing only 0.39 puts per call traded, indicating dangerous complacency and minimal defensive hedging despite consolidation at all-time highs creating latent reversal risk
The Bottom Line on Positioning
The positioning mosaic for Russell index combines greed sentiment with stable volatility conditions. Trend strength registers at 6/10, suggesting meaningful but not extreme directional bias. Taken together, institutional behaviour, crowd psychology, and derivatives data frame the setup heading into the new week.
This analysis covers one dimension. Our full weekly report combines six specialist agents into a single actionable briefing with directional bias, key levels, and risk-opportunity matrix.
Start Free — Get the Market of the WeekFree weekly report · No credit card · Upgrade anytime