Russell 2000 COT & Institutional Positioning — Smart Money Analysis
Russell 2000 institutional positioning: COT data, sentiment analysis and smart money flow assessment.

Where Institutions Stand
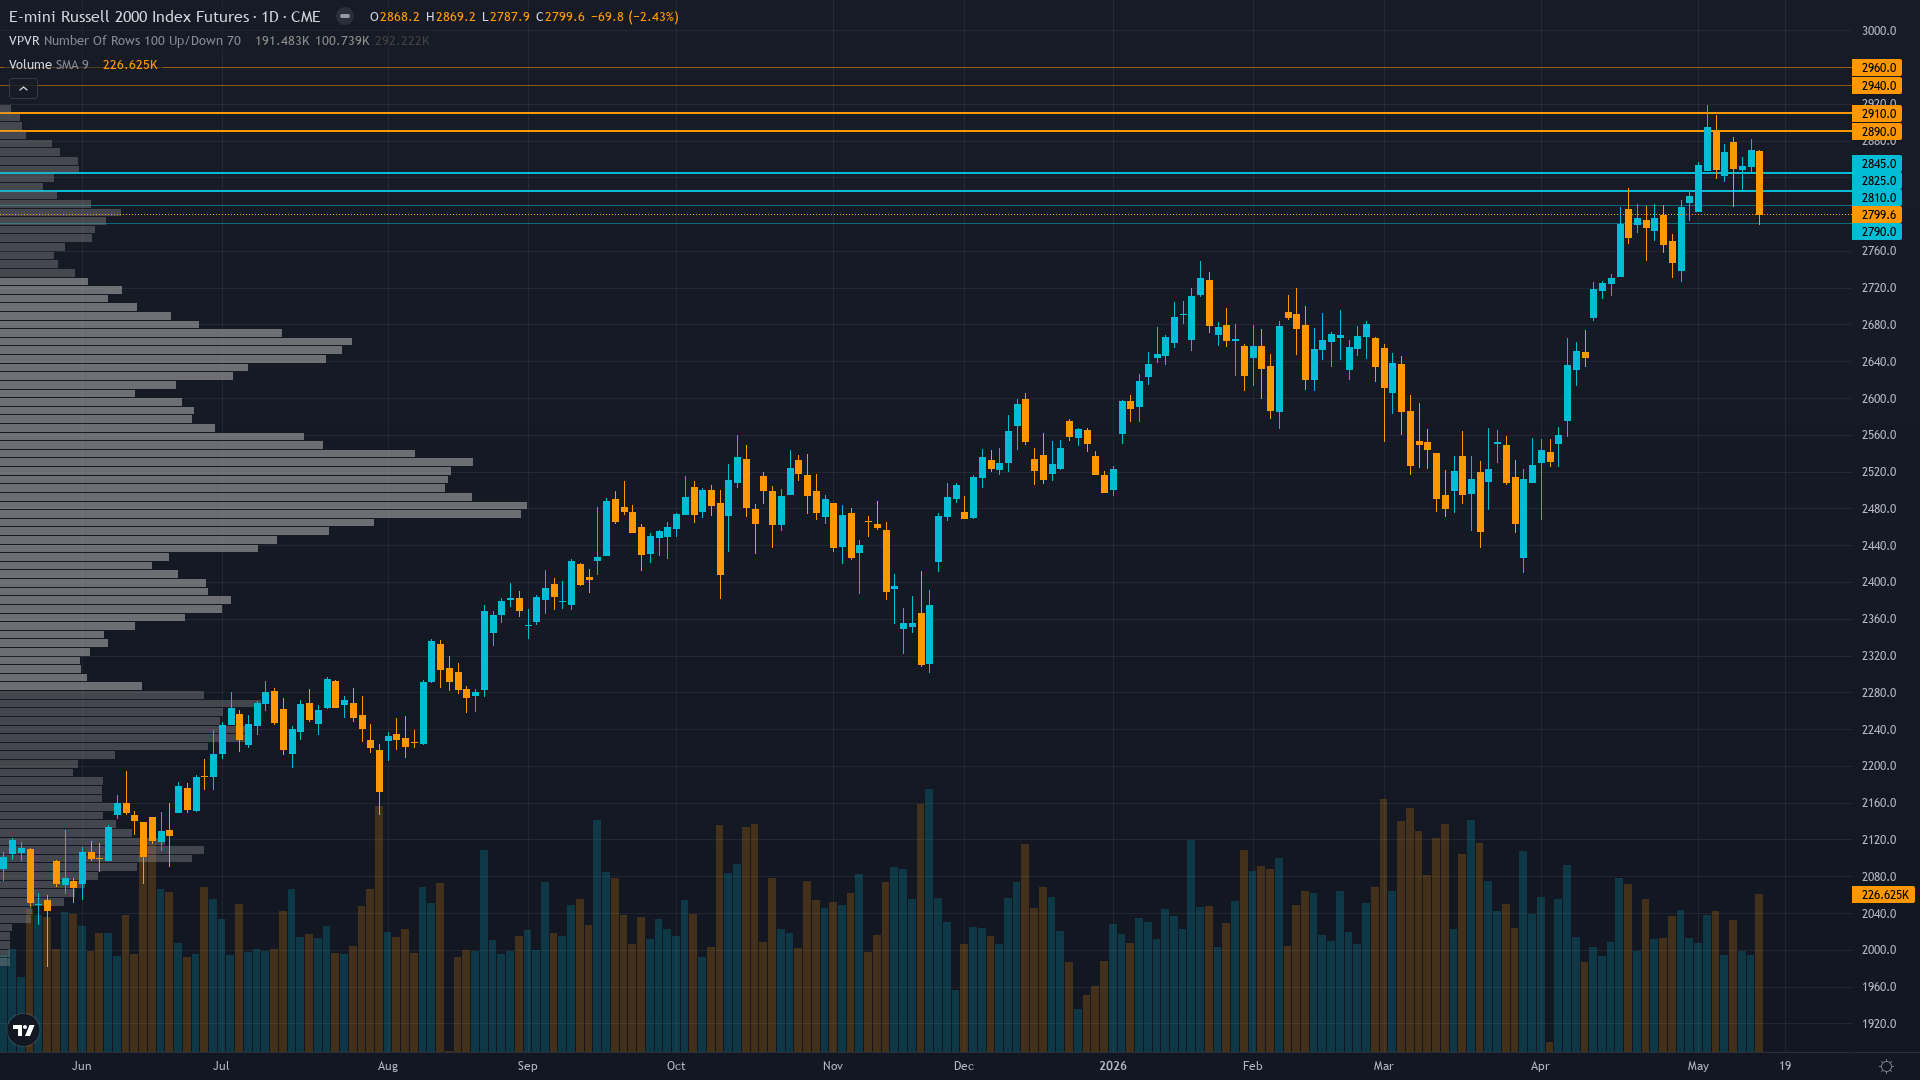
Russell 2000 fell to 2799.6 on a 2.43% decline, with selling pressure dominating price action.
Persistent IWM outflows totaling -$10.8B through 2025 and -$5B YTD 2026 with stale February COT data limiting conviction, institutional smart money distribution pattern continuing despite price resilience through early May
Consensus vs MAD View
Market consensus: Small-caps pulling back from May 6 all-time high at 2,888.62 but maintaining constructive longer-term view on Q1 earnings and eventual Fed easing supporting small-cap rotation narrative
Primary driver: Technical breakdown confirmed with RTY plunging -2.43% today from open at 2,868 to close at 2,799.60, breaking below May 10 ATH of 2,899.30 and trading 3.1% below May 6 all-time high of 2,888.62, invalidating last week's bullish breakout thesis
Where the Crowd May Be Wrong
Desk sees confirmed technical breakdown with 4 of 6 disciplines bearish while market consensus still celebrates prior May 6 ATH and maintains small-cap structural bullish narrative on earnings/Fed easing, creating moderate-high divergence as desk recognizes failed breakout pattern that consensus has not yet fully priced
Crowd Psychology
Neither side has committed heavily to Russell 2000 futures, leaving sentiment in a neutral zone that offers little directional guidance on its own.
Options Flow
VIX at 18.43 up 6.78% on May 15 showing modest volatility expansion while equity put/call at 0.59 extremely low reflects dangerous complacency with call demand dominating puts despite -2.43% daily breakdown creating disconnect
The Bottom Line on Positioning
The positioning mosaic for Russell index combines neutral sentiment with expanding volatility conditions. Trend strength is low at 3/10, indicating weak directional conviction and potential for range-bound behaviour. Taken together, institutional behaviour, crowd psychology, and derivatives data frame the setup heading into the new week.
This analysis covers one dimension. Our full weekly report combines six specialist agents into a single actionable briefing with directional bias, key levels, and risk-opportunity matrix.
Start Free — Get the Market of the WeekFree weekly report · No credit card · Upgrade anytime