Russell 2000 COT & Institutional Positioning — Smart Money Analysis
Russell 2000 institutional positioning: COT data, sentiment analysis and smart money flow assessment.

Where Institutions Stand
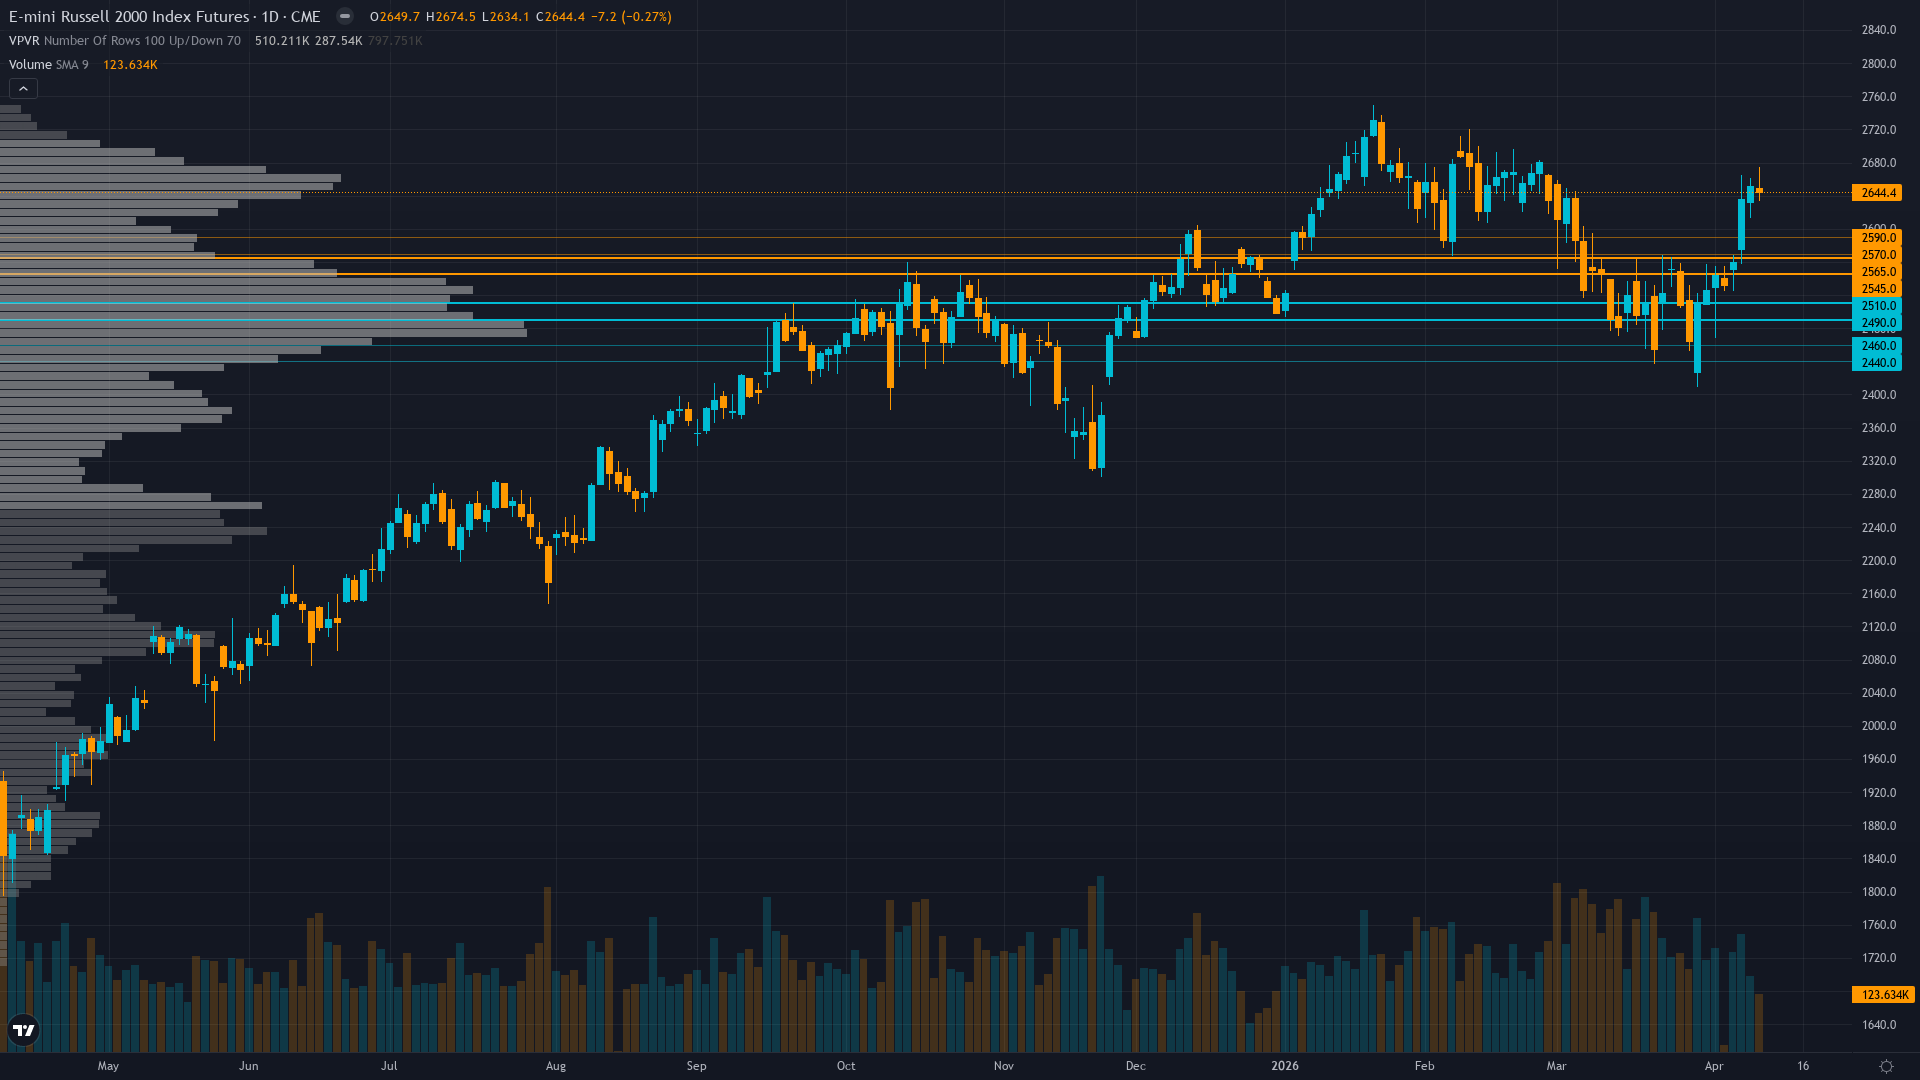
Russell 2000 pushed to 2650 on a 4.45% advance, reflecting sustained demand across the session.
Heavy spec shorts at -45.1% of OI (March 31 data stale) creating short squeeze potential, but IWM outflows of -$7.42B year-to-date show institutional caution despite price strength
Consensus vs MAD View
Market consensus: Small-caps in 'Great Rotation' momentum with IWM surging 12%+ and Q1 earnings season beginning mid-April to test 44.9% growth consensus, but near-term caution warranted on hot CPI removing Fed easing catalyst
Primary driver: VIX collapse from 23.87 to 19.23 over past week creating risk-on environment as fear recedes, combining with last week's 4.45% RTY surge validating sentiment-driven bounce thesis
Where the Crowd May Be Wrong
Desk maintains BULLISH conviction 7 on sentiment normalization and earnings catalyst while consensus 'Great Rotation' narrative creates elevated expectations that desk sees as appropriately priced, creating moderate alignment with slight tactical edge on VIX mean reversion timing
Crowd Psychology
Neither side has committed heavily to Russell 2000 futures, leaving sentiment in a neutral zone that offers little directional guidance on its own.
Options Flow
VIX declined 4.6 points to 19.23 signaling declining fear, equity put/call at 0.51 shows strong call demand indicating bullish positioning without panic hedging
The Bottom Line on Positioning
The positioning mosaic for Russell index combines neutral sentiment with stable volatility conditions. Trend strength registers at 7/10, suggesting meaningful but not extreme directional bias. Taken together, institutional behaviour, crowd psychology, and derivatives data frame the setup heading into the new week.
This analysis covers one dimension. Our full weekly report combines six specialist agents into a single actionable briefing with directional bias, key levels, and risk-opportunity matrix.
Start Free — Get the Market of the WeekFree weekly report · No credit card · Upgrade anytime


