Russell 2000 COT & Institutional Positioning — Smart Money Analysis
Russell 2000 institutional positioning: COT data, sentiment analysis and smart money flow assessment.

Where Institutions Stand
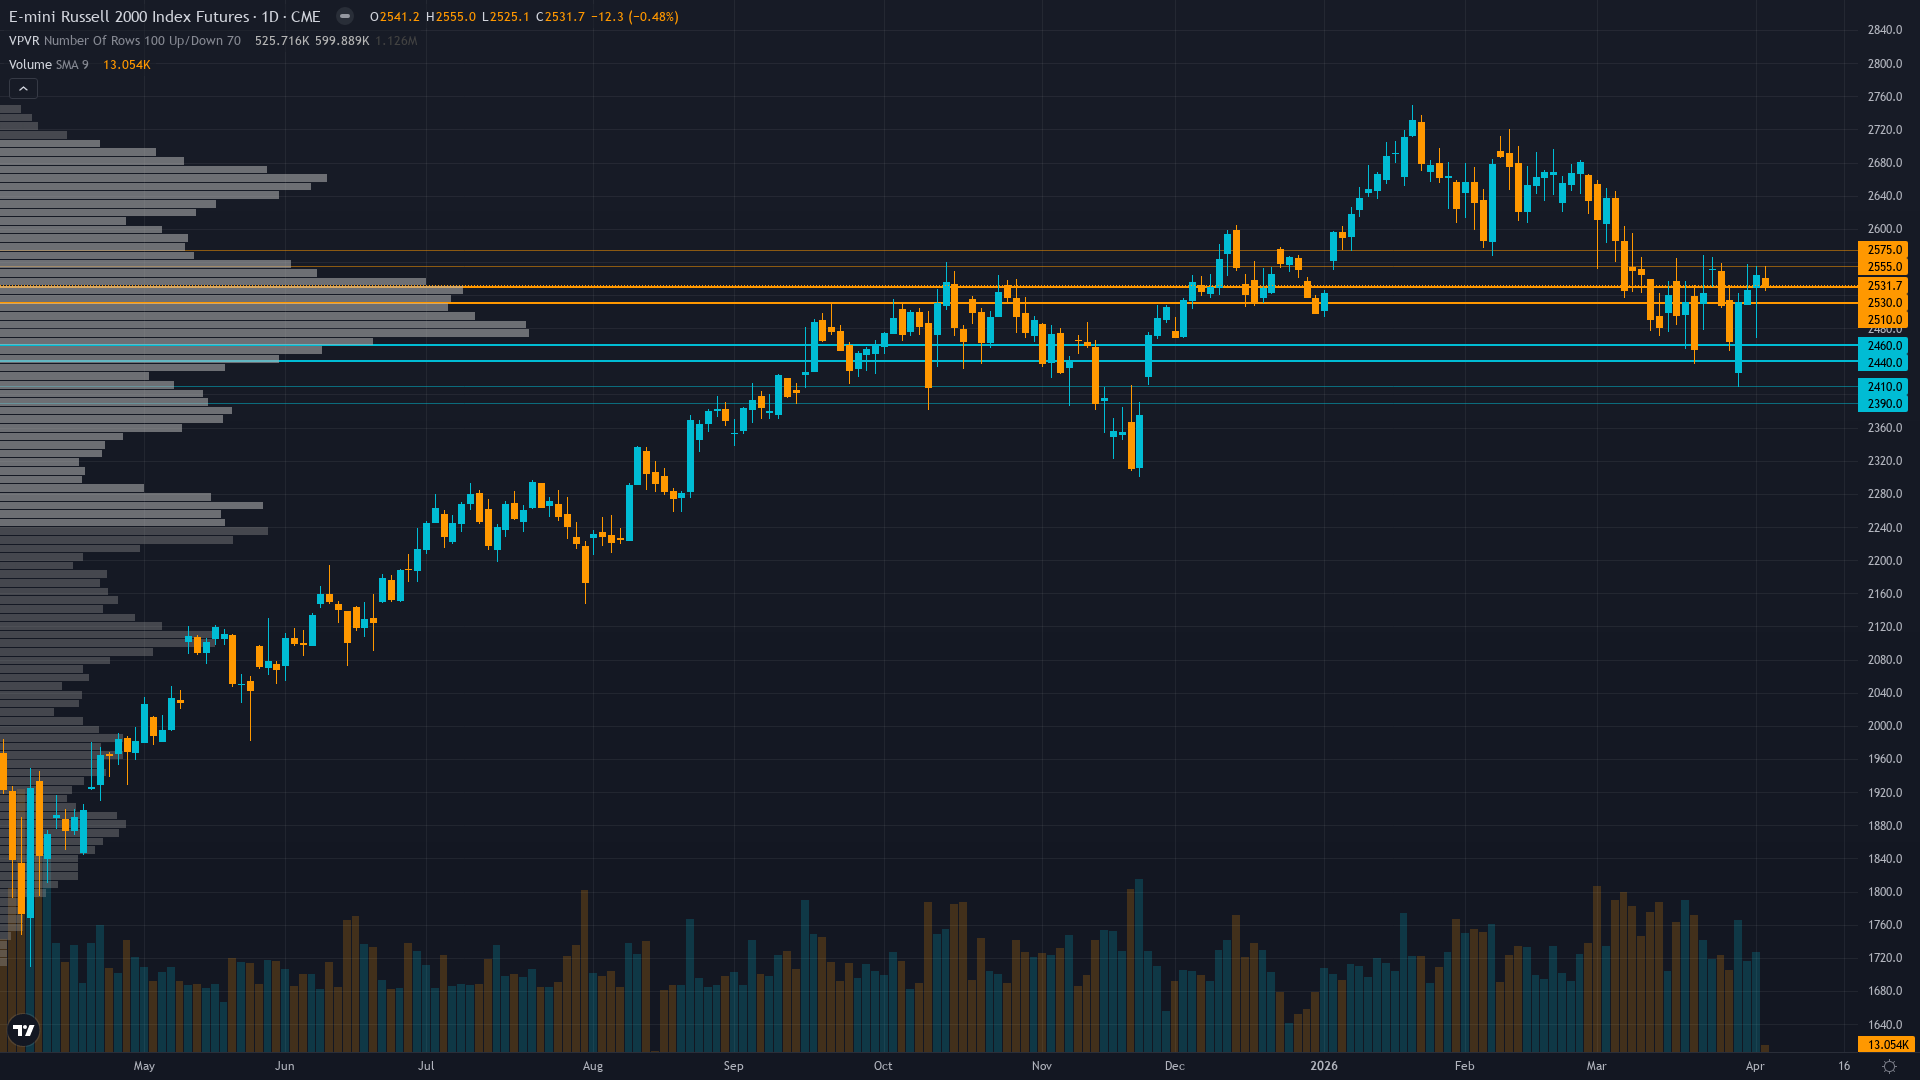
Russell 2000 is trading at 2531.7, down 0.48% in a measured pullback.
Net long positioning reduced with -$2.8B IWM outflows in past 5 days per March data, but stale February COT shows -4.1% OI decline limiting conviction on current flows
Consensus vs MAD View
Market consensus: Small-caps recovering from March correction with 'Great Rotation' narrative emerging as IWM surges 12%+ while large-caps range-bound, but near-term caution warranted into earnings
Primary driver: Strong March NFP print of 178K versus 60K expected delivering fresh positive surprise on April 3, offsetting prior correction fears and supporting small-cap rotation narrative
Where the Crowd May Be Wrong
Desk maintains BULLISH conviction 6 on sentiment-driven bounce into earnings while consensus 'Great Rotation' narrative creates elevated positioning expectations that may be premature, creating moderate divergence as desk sees tactical relief rally rather than structural shift confirmation
Crowd Psychology
Neither side has committed heavily to Russell 2000 futures, leaving sentiment in a neutral zone that offers little directional guidance on its own.
Options Flow
RVX at 32.88 as of March 20 elevated versus VIX 24-27 range indicating small-cap specific fear premium, while equity put/call at 0.59 shows calls still dominate suggesting positioning not yet defensive capitulation
The Bottom Line on Positioning
The positioning mosaic for Russell index combines fear sentiment with stable volatility conditions. Trend strength sits at 5/10, reflecting moderate directional pressure without clear dominance. Taken together, institutional behaviour, crowd psychology, and derivatives data frame the setup heading into the new week.
This analysis covers one dimension. Our full weekly report combines six specialist agents into a single actionable briefing with directional bias, key levels, and risk-opportunity matrix.
Start Free — Get the Market of the WeekFree weekly report · No credit card · Upgrade anytime


