Russell 2000 COT & Institutional Positioning — Smart Money Analysis
Russell 2000 institutional positioning: COT data, sentiment analysis and smart money flow assessment.

Where Institutions Stand
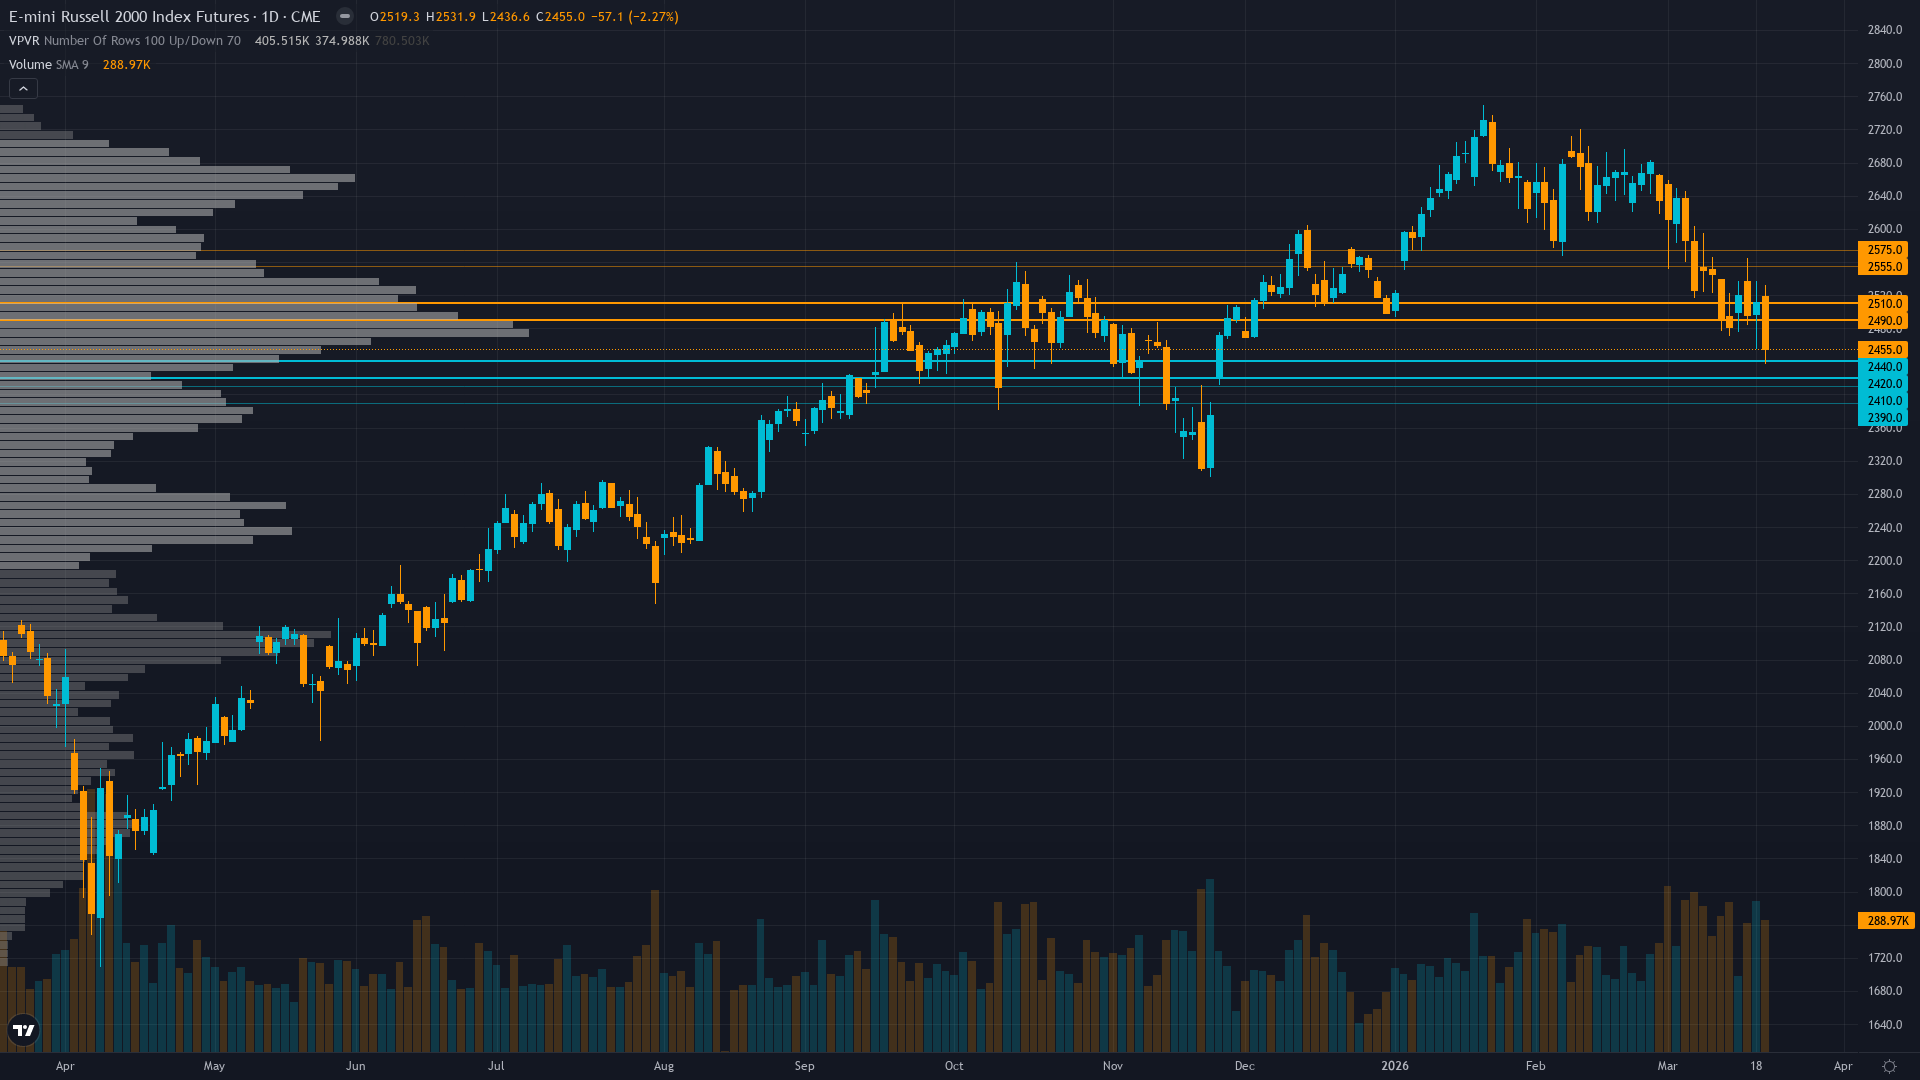
Trading at 2455 after a 1.47% slide, Russell 2000 faces sustained selling interest.
Net long bleeding with sustained IWM outflows totaling -$8.44B over past year, futures OI down 4.1% signaling derisking not accumulation
Consensus vs MAD View
Market consensus: Small-caps under severe pressure from FOMC hawkish pivot removing easing catalyst, but retaining fundamental appeal from 17-22% earnings growth outlook once volatility settles and Fed clarity emerges
Primary driver: March 18 FOMC held rates at 3.5-3.75% with hawkish dot plot raising long-run rate expectations to 3.1%, triggering equity selloff with small-caps bearing brunt as credit-sensitive asset class
Where the Crowd May Be Wrong
Desk bearish lean at low conviction 5 broadly aligns with market fear regime and 5 of 6 disciplines bearish/no-call, creating moderate divergence only from Sentiment's contrarian bullish extreme which desk acknowledges but does not fully fade given lack of capitulation signals
Crowd Psychology
Neither side has committed heavily to Russell 2000 futures, leaving sentiment in a neutral zone that offers little directional guidance on its own.
Options Flow
VIX spike to 26.78 from prior week's lower levels signals fear regime expansion, IWM put/call 2.74 shows defensive positioning but not panic capitulation
The Bottom Line on Positioning
The positioning mosaic for Russell index combines fear sentiment with expanding volatility conditions. Trend strength is low at 3/10, indicating weak directional conviction and potential for range-bound behaviour. Taken together, institutional behaviour, crowd psychology, and derivatives data frame the setup heading into the new week.
This analysis covers one dimension. Our full weekly report combines six specialist agents into a single actionable briefing with directional bias, key levels, and risk-opportunity matrix.
Start Free — Get the Market of the WeekFree weekly report · No credit card · Upgrade anytime


