Platinum Forecast This Week — Outlook, Drivers & Key Levels
This week's Platinum outlook: key drivers, volatility context, risk-opportunity assessment and the week ahead.

Market Overview
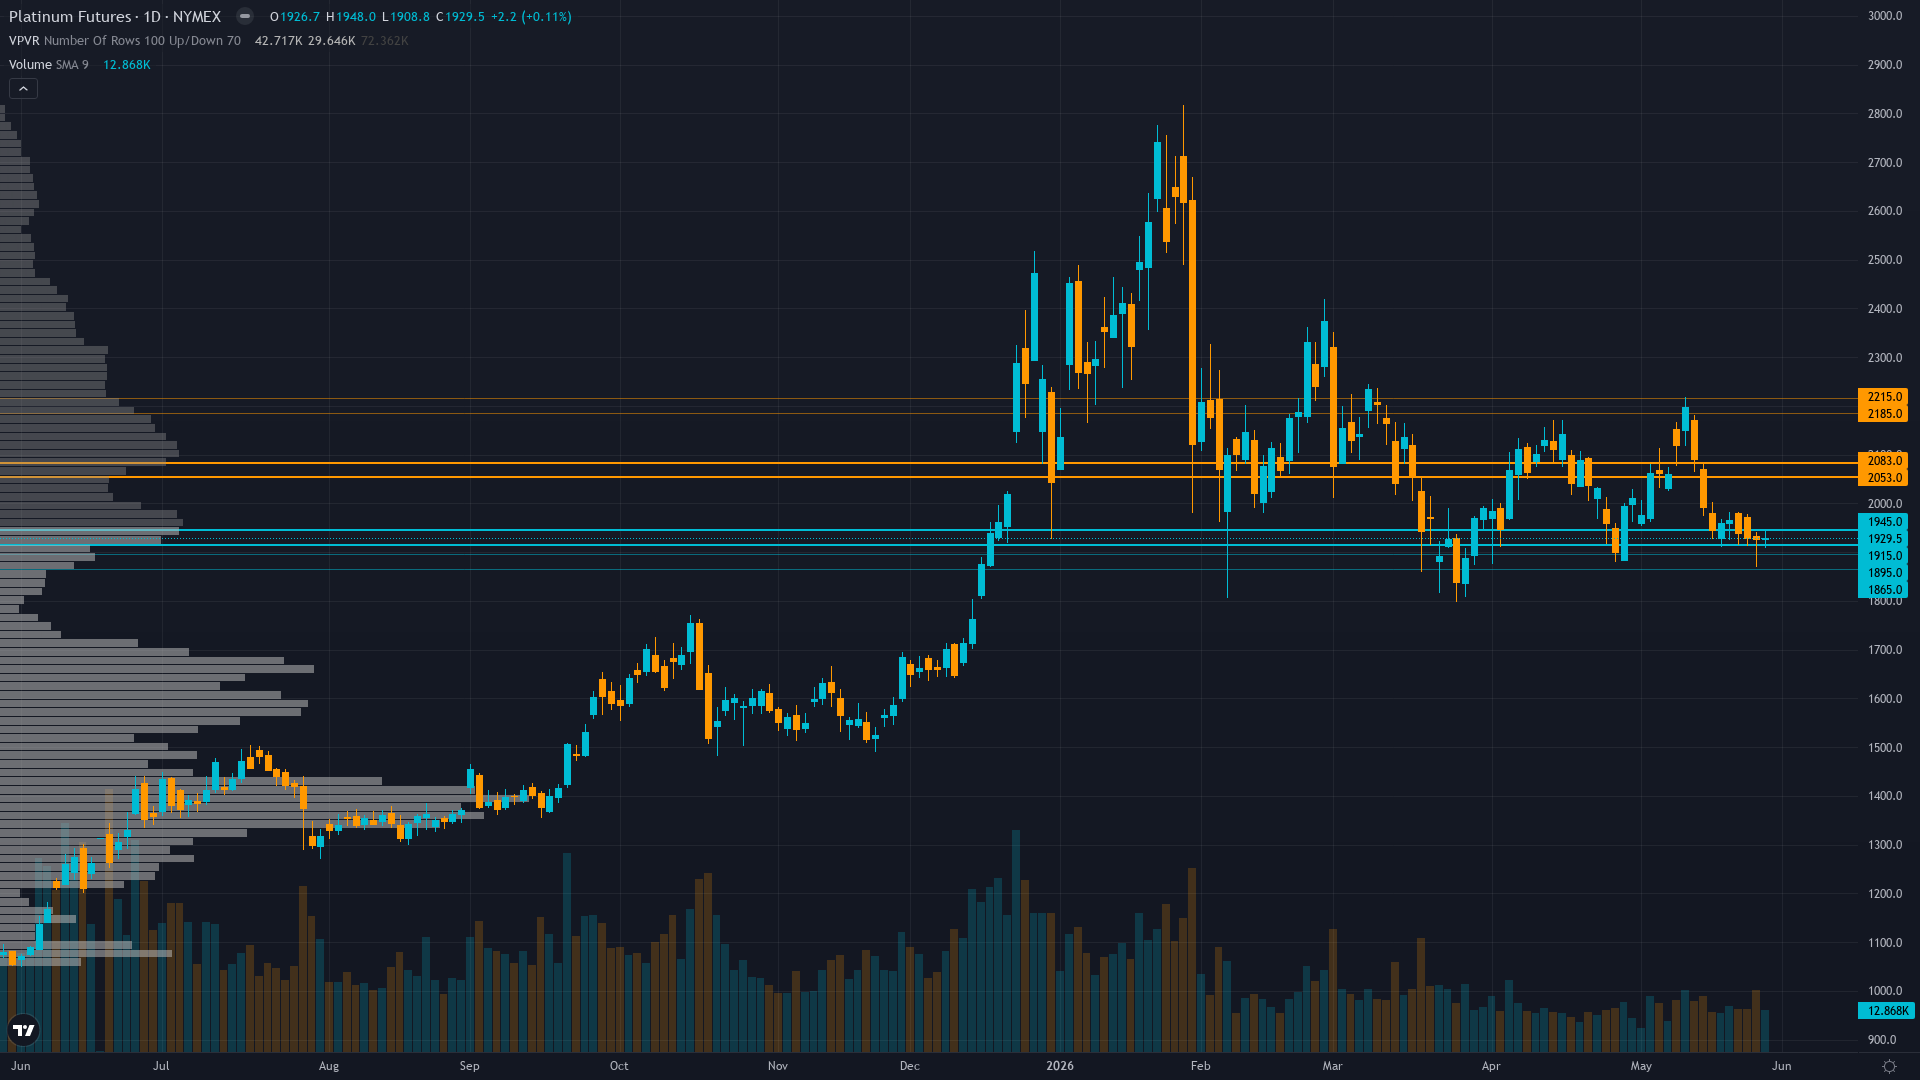
At 1926.5, platinum has eased 0.15% in a controlled retreat. platinum futures is in a breaking down market state, requiring careful assessment of current conditions.
Market digesting May 18 WPIC Q1 2026 report paradox showing Q1 surplus 268 koz contradicting full-year deficit upgrade to 297 koz, with -6.8% post-announcement decline suggesting profit-taking or forecasting skepticism overwhelming structural scarcity thesis requiring time for directional resolution
This Week's Catalysts & Drivers
Primary driver: Mandatory NEUTRAL reset triggered after four consecutive MISSED calls per Rule 5 — execution timing has catastrophically failed despite WPIC May 18 Q1 report upgrading full-year 2026 deficit to 297 koz as price rejects bullish catalyst with -6.8% post-announcement decline suggesting profit-taking or credibility skepticism overwhelming scarcity thesis
Secondary factor: WPIC May 18 Q1 2026 report creates fundamental paradox: Q1 surplus of 268 koz (first in six quarters, +18% YoY supply growth) contradicts full-year deficit upgrade to 297 koz from 240 koz March estimate, creating tension between near-term supply response and structural scarcity thesis requiring market digestion period
Additional influence: Technical breakdown accelerating with price declining from $2,068 May 17 to current $1,926.50 (May 29 close), testing critical $1,880-1,900 support zone following May 18 WPIC catalyst rejection while managed money net long at 13,334 contracts (May 27 COT) shows early liquidation signs with -2,777 contract weekly reduction
Economic backdrop: Fed on hold at 3.5-3.75% range with real yields elevated at 2.00-2.05% creating persistent headwind for non-yielding assets; USD strength at DXY 100.36 and VIX normalization to 17.44 reduce safe-haven premium despite structural deficit thesis
Fundamental assessment: WPIC May 18 Q1 2026 report shows Q1 surplus 268 koz (first in six quarters) driven by 18% YoY supply growth, yet UPGRADED full-year 2026 deficit to 297 koz from 240 koz March estimate with above-ground stocks at critically low 2.613M oz (4-month supply) creating paradox: near-term supply response vs structural multi-year scarcity averaging 689 koz deficits 2026-2029
Technical Picture
Breakdown structure confirmed with price declining from $2,068 May 17 to $1,926.50 (May 29 close) following May 18 WPIC report, testing critical $1,880-1,900 support zone with declining open interest suggesting liquidation rather than consolidation; 52-week range $930-$2,915 places current price at 51st percentile representing mid-range neither extreme
At 3/10, trend strength is subdued, suggesting the market lacks a clear directional mandate.
Bull & Bear Case
Primary risk: Continued breakdown below $1,880 February low triggers technical cascade toward $1,700-1,800 major support despite WPIC May 18 full-year deficit upgrade as market prioritizes Q1 surplus evidence of supply response over structural scarcity thesis, with four-miss execution failure reducing credibility of any directional assessment creating 8-12% downside risk within 2-4 weeks (Probability: medium)
Primary opportunity: Reversal from $1,880-1,800 support zone if market reprices WPIC May 18 full-year deficit upgrade (297 koz vs 240 koz March estimate) over Q1 surplus noise, recognizing 18% YoY supply growth as unsustainable response validating structural scarcity with critically low 4-month inventory coverage enabling rally toward $2,200 resistance over 6-10 weeks (Timeframe: 6-10 weeks contingent on sustained hold above $1,800 major support and market digestion of May 18 WPIC report paradox allowing fundamental multi-year deficit thesis (689 koz average annually 2026-2029) to reassert over Q1 supply response and macro headwinds)
This week's edge: Resetting after 4 consecutive misses per Rule 5 — thesis under review. WPIC May 18 fundamental paradox (Q1 surplus vs full-year deficit upgrade) represents material new information market rejecting short-term; structural multi-year scarcity (689 koz average deficits 2026-2029, 4-month inventory coverage) may be underweighted or correctly discounted pending supply response validation requiring 2-4 week digestion before resuming directional bias
Volatility Regime
Volatility for platinum price sits at the 78th percentile over 90 days — an elevated regime that demands wider risk parameters and faster decision-making. The vol trend is down, with contraction across timeframes creating the kind of coiled conditions that historically resolve explosively.
High but contracting volatility suggests daily ranges of $60-100 expected versus $150-200 during peak January-March phase; breakdown below $1,800 would likely expand ranges to $80-120 on stop-triggered selling while sustained hold enables compression to $40-80 signaling consolidation completion
What to Watch
The WPIC Platinum Quarterly Q2 2026 report scheduled September 9 will provide updated supply-demand data validating or challenging May 18 Q1 surplus/full-year deficit upgrade paradox with actual H1 performance versus November 2025 projections on Wednesday 9 September stands as the week's primary risk event — high-impact and capable of overriding the existing technical and sentiment setup.
The interplay between breaking down market conditions and upcoming catalysts will define this week's trading landscape for NYMEX platinum.
This analysis covers one dimension. Our full weekly report combines six specialist agents into a single actionable briefing with directional bias, key levels, and risk-opportunity matrix.
Start Free — Get the Market of the WeekFree weekly report · No credit card · Upgrade anytime


