Nasdaq 100 Key Levels This Week — Support, Resistance & Confluence Zones
Nasdaq 100 key levels breakdown: support zones, resistance zones, confluence and price structure.

Price Architecture
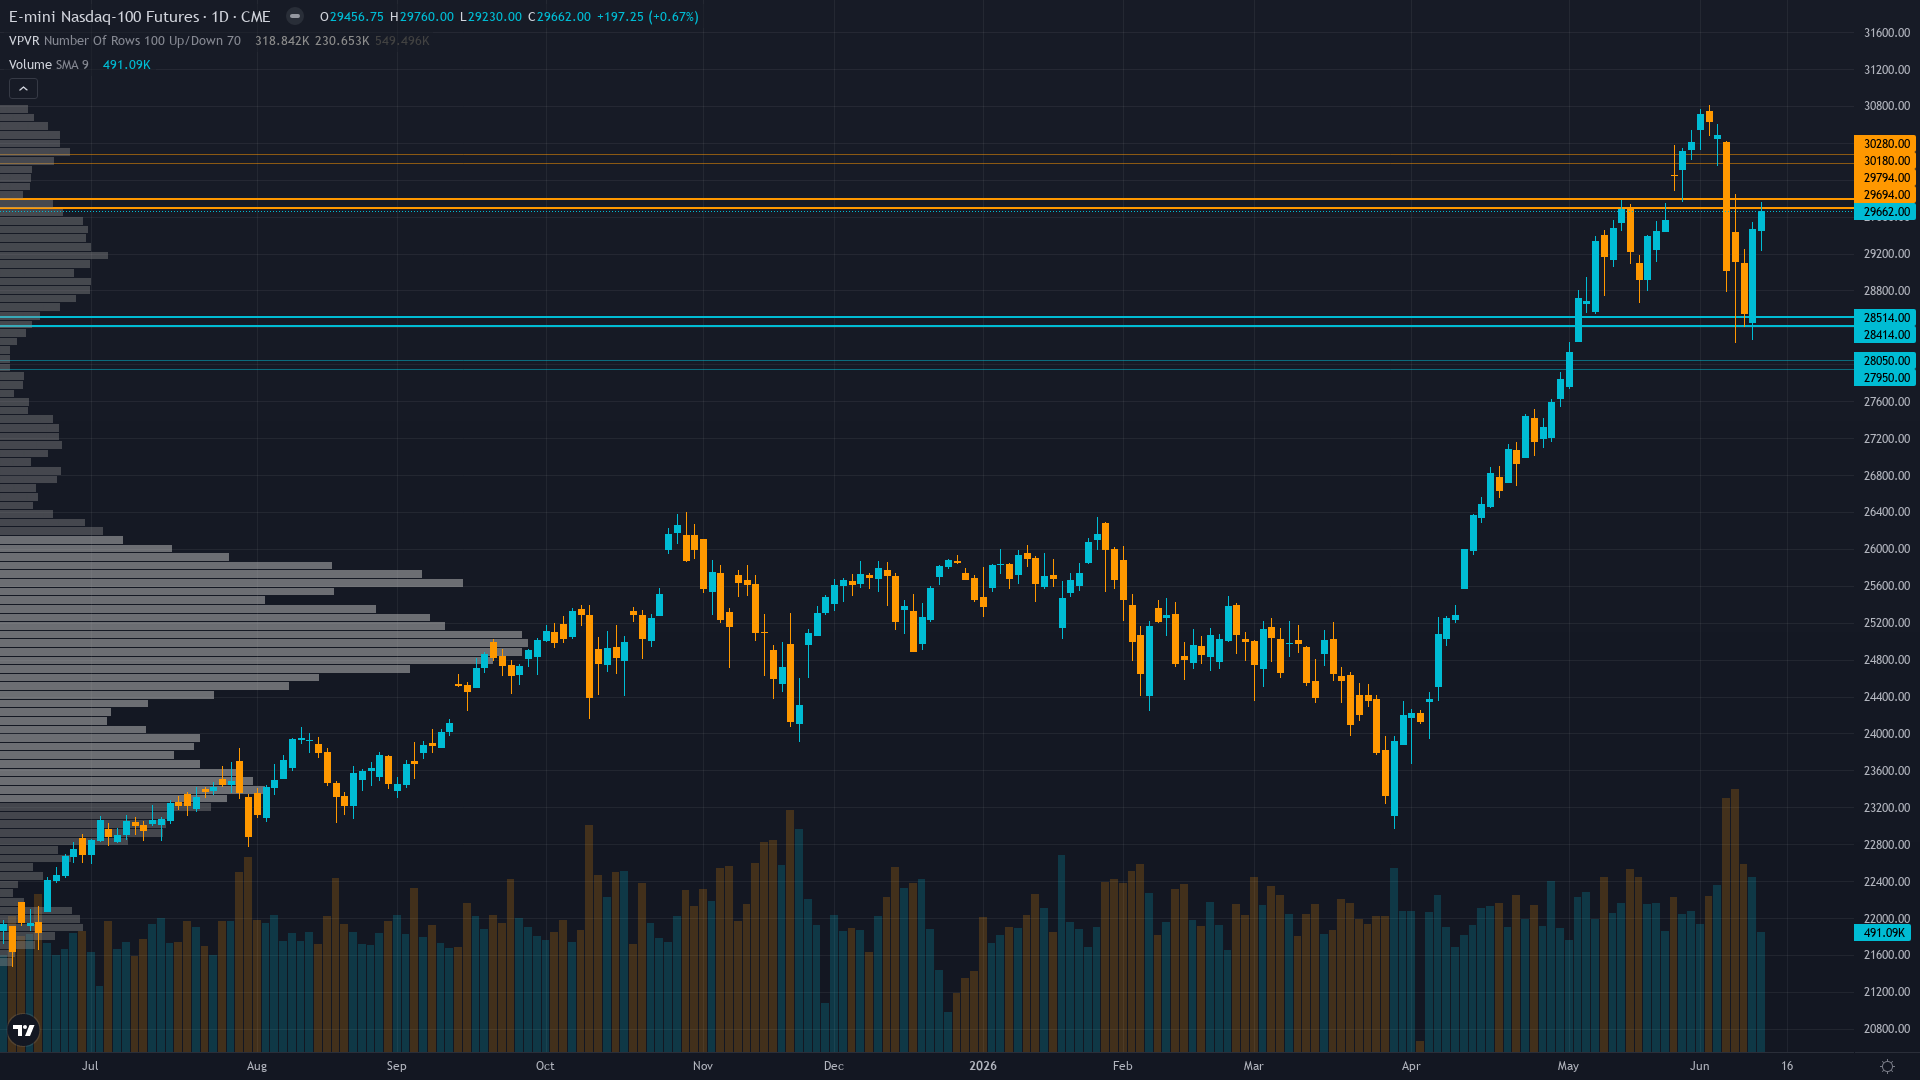
Nasdaq 100 holds at 29662, up a marginal 0.67% as the market grinds forward. The market in Nasdaq 100 futures is coiling, with narrowing price ranges suggesting stored energy that will eventually release.
Contested zone between 50-day MA resistance at 29,535 and 200-day MA support at 29,320 with price at 29,662, RSI 57.15 neutral, intraday range 29,230-29,760 showing volatility but no breakout confirmation
Trend strength sits at 5/10, reflecting moderate directional pressure without clear dominance.
Downside Protection
The downside architecture for tech futures features support zones rooted in prior buying activity. These are not arbitrary lines but areas where real capital has previously been committed.
The reliability of support under TRANSITIONAL with mixed signals. VIX at 19.44 sits below 20 threshold indicating normalized conditions, but Economic agent flags June 16-17 FOMC removing easing language as fresh hawkish catalyst occurring in 3 days. Equities consolidating between 50-day MA (29,535) and 200-day MA (29,320) without clear directional conviction. The regime lacks structural advantage for either direction absent specific catalyst strong enough to override fundamental repricing underway from dovish-to-hawkish Fed shift. conditions is shaped by the interplay between volatility regime and historical volume at each level.
Resistance Zone Context
The upside path for NQ futures is marked by resistance zones where prior selling activity created structural barriers. Clearing these zones requires either strong momentum or a shift in the fundamental picture.
In the current market state, resistance zones remain key decision points.
Analytical Convergence
The most actionable levels for Nasdaq 100 are those where multiple analytical disciplines converge. When technical structure, institutional positioning, and options flow all point to the same zone, the probability of price reacting there increases meaningfully.
High volatility at 72nd percentile suggests 1.4-1.7x normal daily ranges; expect 350-420 point daily swings versus normal 250-300 ranges; breakouts above 29,760 or breakdowns below 29,230 carry moderate sustainability risk until VIX compresses below 65th percentile
Our Multi-Agent Approach to Key Levels
The levels in our paid reports are generated by six specialist agents working in parallel. Technical analysis provides the structural framework, institutional data shows where capital is committed, options flow reveals hedging behaviour, fundamentals anchor levels to value, sentiment gauges crowd positioning, and economic analysis times the catalysts.
The output is a curated set of levels with institutional-grade validation — the kind of multi-dimensional analysis that hedge fund research desks produce, delivered at a fraction of the cost.
Our paid reports include specific support and resistance levels identified by six specialist agents — technical structure, institutional positioning, options flow, fundamentals, sentiment, and economic analysis. Not just lines on a chart, but zones validated by multi-discipline confluence.
Start Free — Get the Market of the WeekFree weekly report · No credit card · Upgrade anytime