Nasdaq 100 Key Levels This Week — Support, Resistance & Confluence Zones
Nasdaq 100 key levels breakdown: support zones, resistance zones, confluence and price structure.

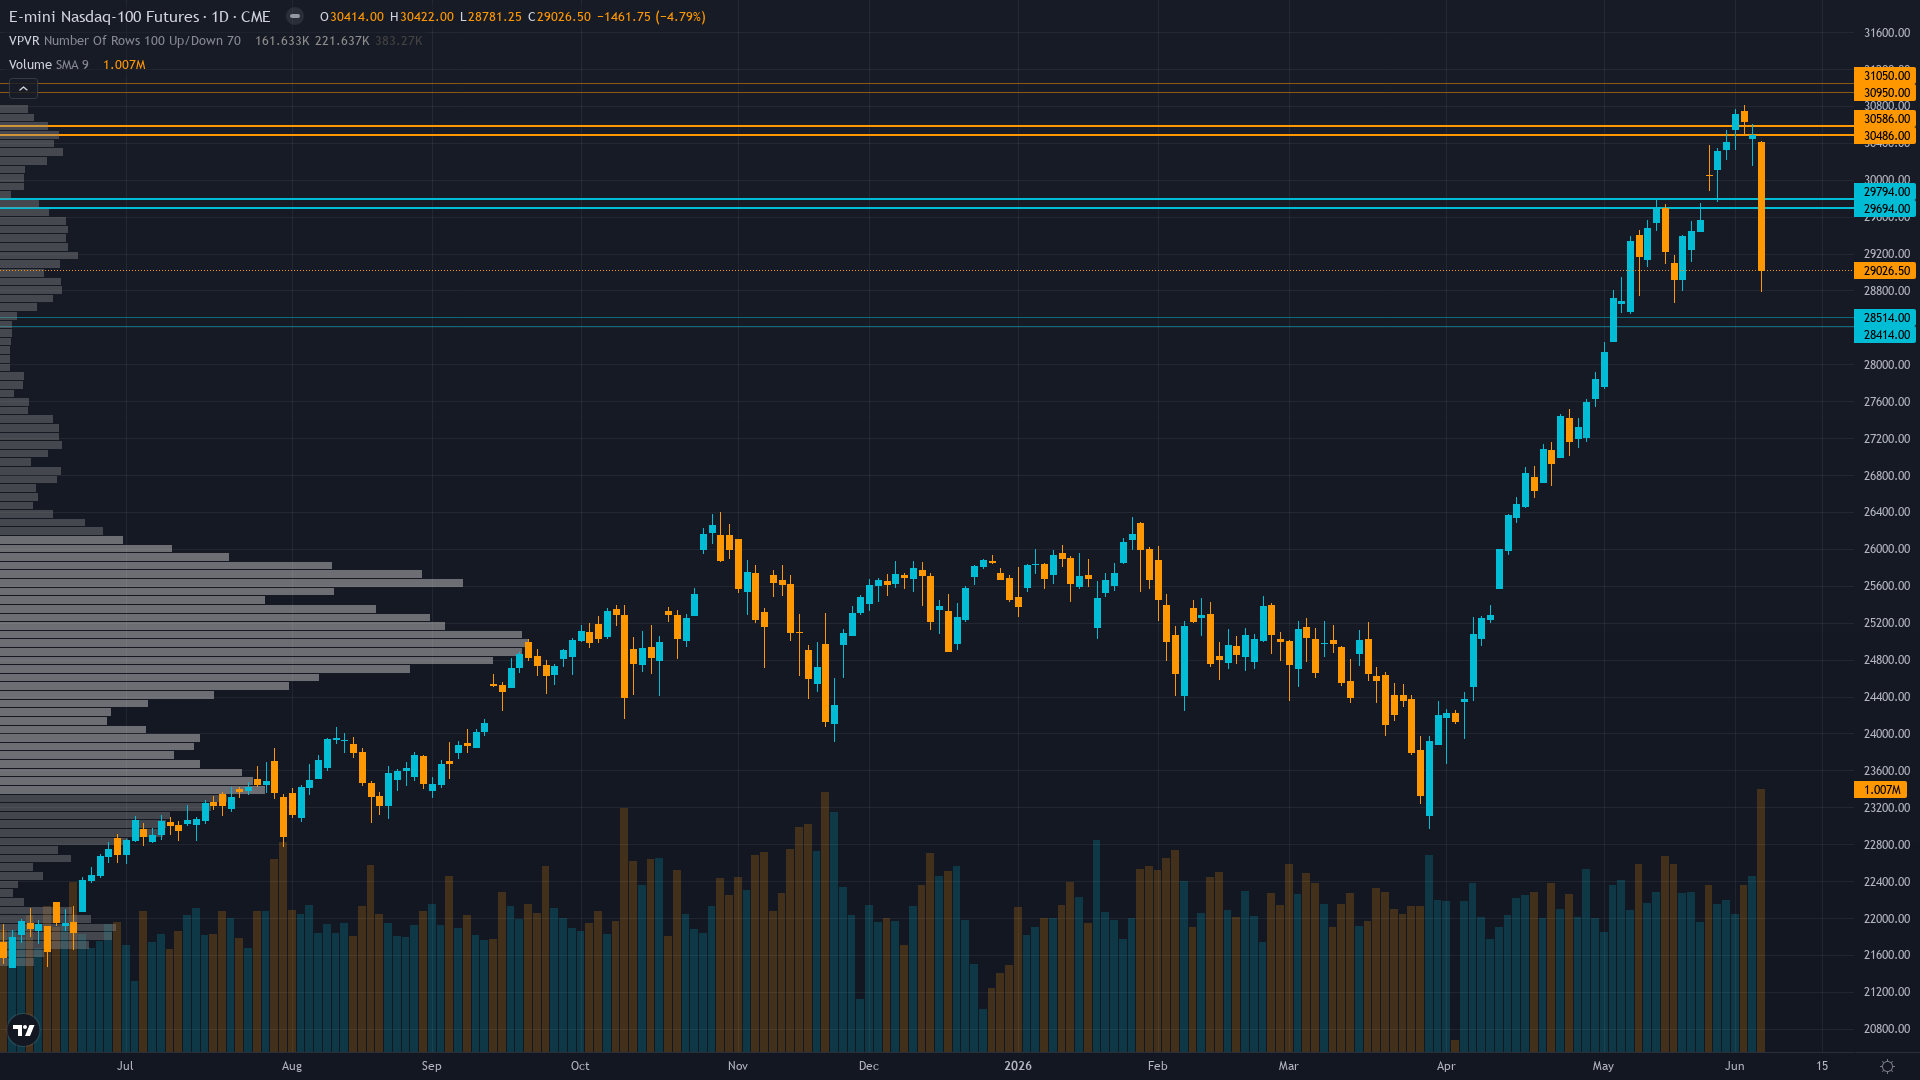
Where Price Sits
Nasdaq 100 sits at 29026, having shed 4.79% as bears maintain the upper hand. Nasdaq 100 futures is in a breaking down market state, requiring careful assessment of current conditions.
Breakdown structure with price at 29,026 below 50-day MA (29,744) but above 200-day MA (28,464), sharp 1,200-point intraday reversal from 30,230 high to 28,781 low on June 7 indicates momentum loss, RSI 64.6 elevated but declining, 50-day MA now overhead resistance after breakdown
Trend strength registers just 3/10, which typically corresponds to choppy, directionless price action.
Floors & Demand Zones
NQ futures has identifiable support zones below current price where buying interest has historically emerged. These zones represent areas where institutional participants have previously defended price, creating potential floors for pullbacks.
How effectively these zones hold depends on the prevailing regime and whether the volume profile confirms institutional participation.
Resistance Architecture
Above current price, tech futures encounters structural resistance defined by prior supply zones and profit-taking clusters. These barriers must be overcome convincingly for the upside thesis to develop.
The reliability of resistance depends on the number of touches and the volume traded at each level.
Multi-Agent Confluence
What separates high-probability levels from noise is multi-discipline agreement. The key zones for NQ futures are those where technical structure aligns with institutional positioning and options market activity.
Elevated volatility at 72nd percentile suggests 1.4-1.8x normal daily ranges; expect 350-450 point daily swings versus normal 250-300 ranges; breakouts above 29,744 or breakdowns below 28,464 carry higher sustainability risk until VIX compresses below 65th percentile, requiring wider stops and cautious position sizing
The Intelligence Behind the Levels
Our multi-agent system analyses key levels from six perspectives simultaneously: technical structure identifies the zones, institutional positioning reveals where smart money is engaged, options flow shows where hedging clusters, fundamentals assess whether levels align with fair value, sentiment measures crowd positioning around levels, and economic data flags catalysts that could trigger level tests.
The result is a set of levels that reflect genuine multi-agent consensus, not the output of a single indicator or a retail trader drawing trendlines.
Our paid reports include specific support and resistance levels identified by six specialist agents — technical structure, institutional positioning, options flow, fundamentals, sentiment, and economic analysis. Not just lines on a chart, but zones validated by multi-discipline confluence.
Start Free — Get the Market of the WeekFree weekly report · No credit card · Upgrade anytime


