Nasdaq 100 Key Levels This Week — Support, Resistance & Confluence Zones
Nasdaq 100 key levels breakdown: support zones, resistance zones, confluence and price structure.

Price Architecture
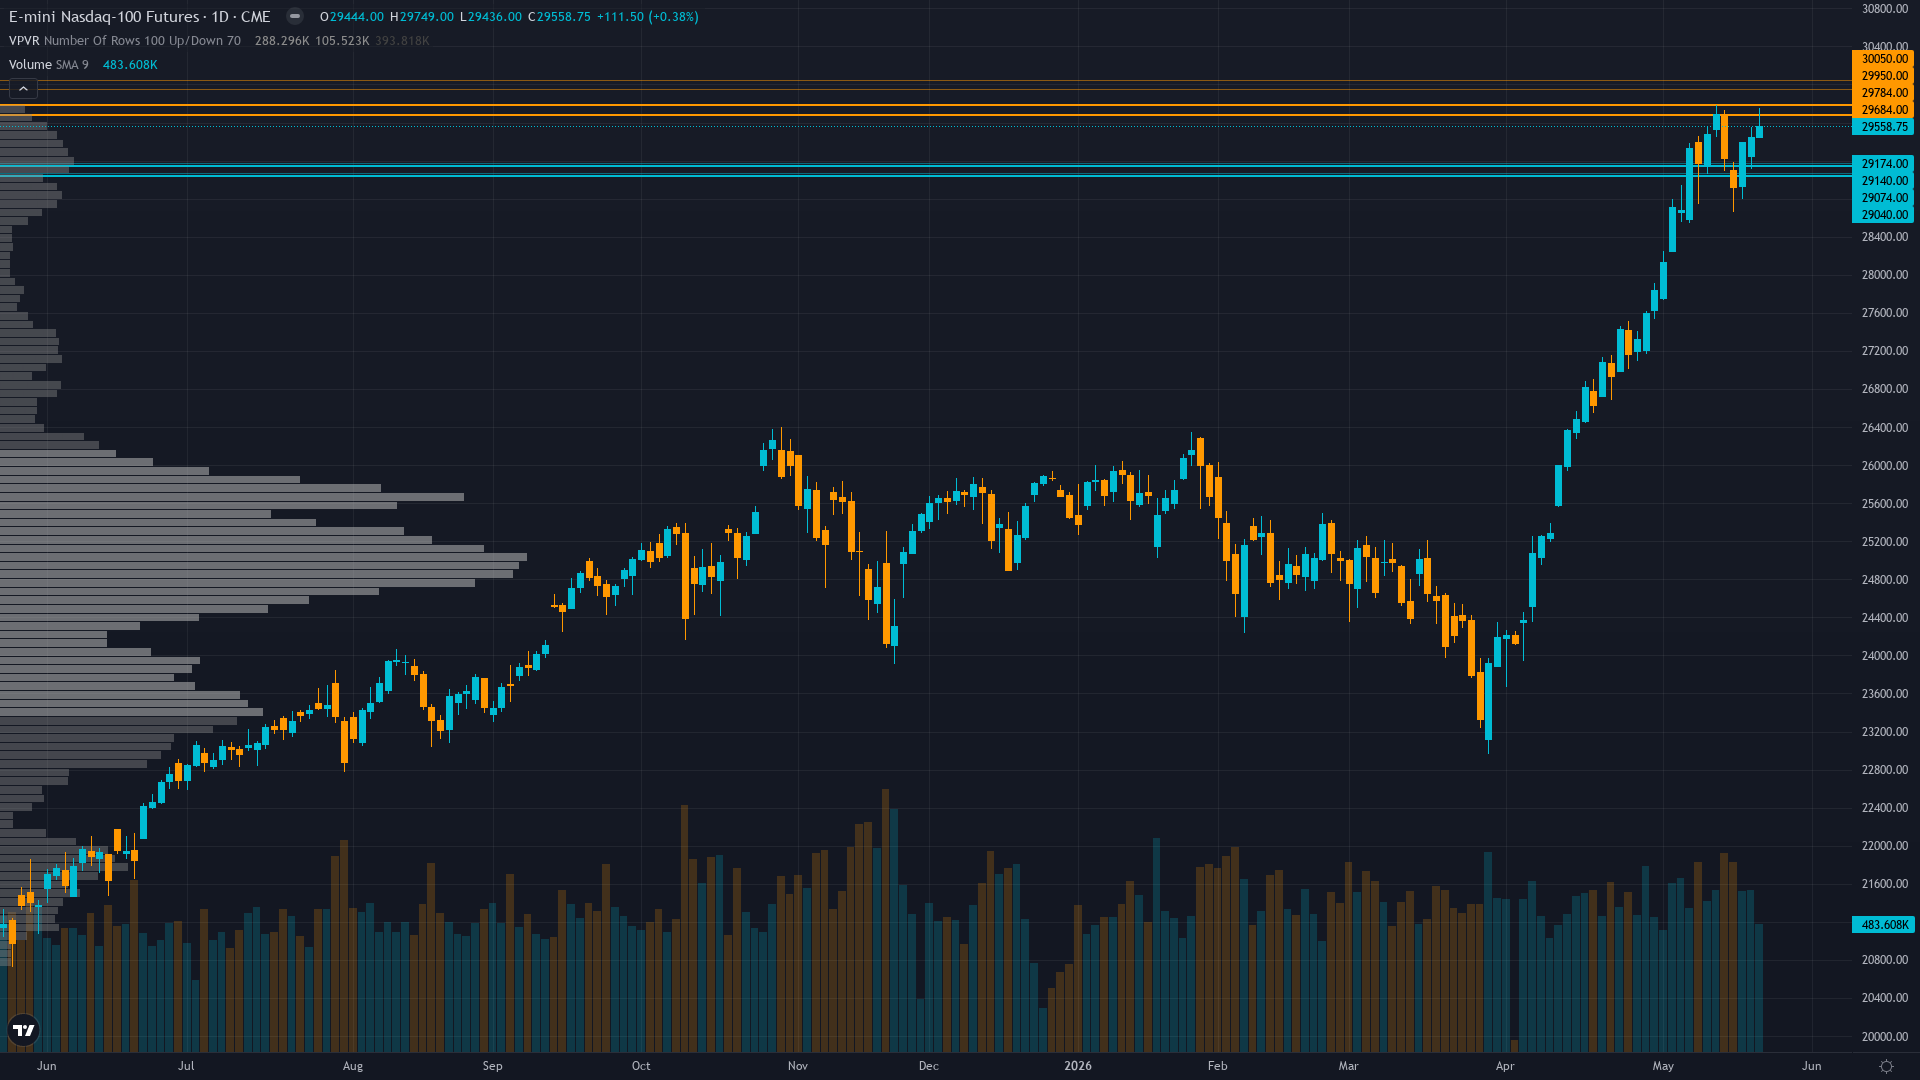
Nasdaq 100 is trading at 29558.75, up a modest 0.38% as the market edges higher. The market in Nasdaq 100 futures is coiling, with narrowing price ranges suggesting stored energy that will eventually release.
Powerful uptrend with price at 29,558 extending above new 52-week high of 29,749 set May 22, trading 352 points above 50-day MA (29,206) and 1,708 points above 200-day MA (27,850), RSI 65.1 bullish but not overbought, all moving averages aligned bullishly confirming trend strength with no bearish divergence present
Trend strength registers at 7/10, suggesting meaningful but not extreme directional bias.
Downside Protection
The downside architecture for tech futures features support zones rooted in prior buying activity. These are not arbitrary lines but areas where real capital has previously been committed.
The reliability of support under RISK-ON with VIX at 16.70 well below 20 threshold indicating normalized risk appetite, equities in powerful uptrend setting new all-time highs, Fed on hold at 3.5-3.75% maintaining accommodative conditions, credit spreads stable, USD range-bound, regime strongly supportive of continued risk asset appreciation with structural AI capex tailwind providing multi-quarter fundamental support conditions is shaped by the interplay between volatility regime and historical volume at each level.
Resistance Zone Context
The upside path for NQ futures is marked by resistance zones where prior selling activity created structural barriers. Clearing these zones requires either strong momentum or a shift in the fundamental picture.
In the current market state, resistance zones remain key decision points.
Analytical Convergence
The most actionable levels for Nasdaq 100 are those where multiple analytical disciplines converge. When technical structure, institutional positioning, and options flow all point to the same zone, the probability of price reacting there increases meaningfully.
Normal volatility at 52nd percentile suggests 1.0-1.2x normal daily ranges; expect 250-300 point daily swings versus March extreme's 400-550 ranges; breakouts above 29,749 or pullbacks to 29,206 carry moderate sustainability as normalized vol allows tighter stops and standard position sizing versus defensive March stance
Our Multi-Agent Approach to Key Levels
The levels in our paid reports are generated by six specialist agents working in parallel. Technical analysis provides the structural framework, institutional data shows where capital is committed, options flow reveals hedging behaviour, fundamentals anchor levels to value, sentiment gauges crowd positioning, and economic analysis times the catalysts.
The output is a curated set of levels with institutional-grade validation — the kind of multi-dimensional analysis that hedge fund research desks produce, delivered at a fraction of the cost.
Our paid reports include specific support and resistance levels identified by six specialist agents — technical structure, institutional positioning, options flow, fundamentals, sentiment, and economic analysis. Not just lines on a chart, but zones validated by multi-discipline confluence.
Start Free — Get the Market of the WeekFree weekly report · No credit card · Upgrade anytime


