Nasdaq 100 Key Levels This Week — Support, Resistance & Confluence Zones
Nasdaq 100 key levels breakdown: support zones, resistance zones, confluence and price structure.

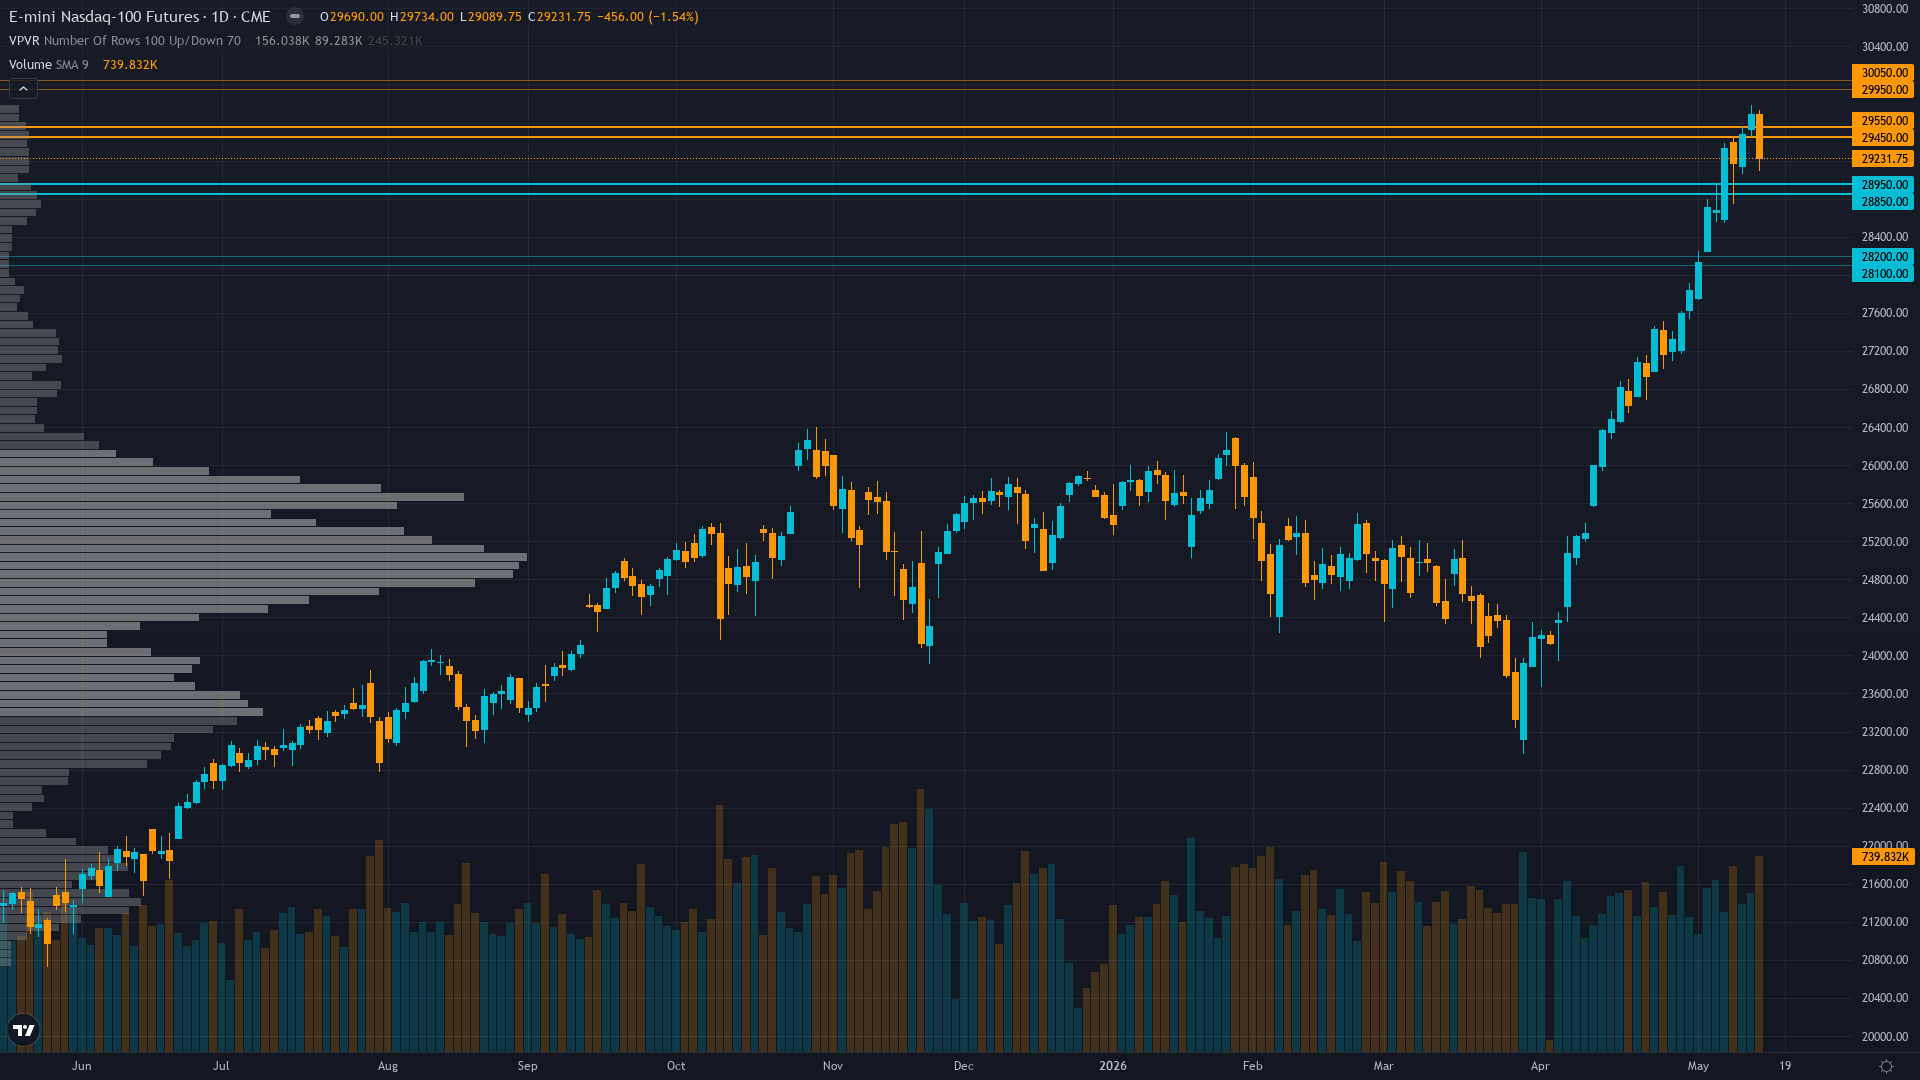
Price Architecture
Nasdaq 100 is trading at 29231.75, down 1.54% as selling pressure weighs on price. The market in Nasdaq 100 futures is coiling, with narrowing price ranges suggesting stored energy that will eventually release.
Uptrend intact but weakening with price at 29,232 above 50-day MA (29,124) and well above 200-day MA (27,202) confirming longer-term bullish structure, but failure to break above 30,000 resistance and close below 5-day MA (29,234) signals near-term momentum loss with RSI at 45.4 neutral showing no divergence
Trend strength registers at 6/10, suggesting meaningful but not extreme directional bias.
Downside Protection
The downside architecture for tech futures features support zones rooted in prior buying activity. These are not arbitrary lines but areas where real capital has previously been committed.
The reliability of support under TRANSITIONAL bordering RISK-OFF as April CPI inflation surprise (3.4% vs 3.0% prior) released May 13 shifts Fed policy expectations from dovish cut bias to hawkish hold, with VIX rising to 18.43 (+6.78% on day) and NQ falling -1.54% indicating early repricing underway though credit spreads remain stable and regime not yet fully risk-off conditions is shaped by the interplay between volatility regime and historical volume at each level.
Resistance Zone Context
The upside path for NQ futures is marked by resistance zones where prior selling activity created structural barriers. Clearing these zones requires either strong momentum or a shift in the fundamental picture.
In the current market state, resistance zones remain key decision points.
Analytical Convergence
The most actionable levels for Nasdaq 100 are those where multiple analytical disciplines converge. When technical structure, institutional positioning, and options flow all point to the same zone, the probability of price reacting there increases meaningfully.
Normal volatility at 52nd percentile suggests 1.0-1.2x normal daily ranges; expect 280-330 point daily swings versus normal 250-280 ranges; breakouts above 29,734 or breakdowns below 29,090 carry moderate sustainability as normalized vol allows standard position sizing
Our Multi-Agent Approach to Key Levels
The levels in our paid reports are generated by six specialist agents working in parallel. Technical analysis provides the structural framework, institutional data shows where capital is committed, options flow reveals hedging behaviour, fundamentals anchor levels to value, sentiment gauges crowd positioning, and economic analysis times the catalysts.
The output is a curated set of levels with institutional-grade validation — the kind of multi-dimensional analysis that hedge fund research desks produce, delivered at a fraction of the cost.
Our paid reports include specific support and resistance levels identified by six specialist agents — technical structure, institutional positioning, options flow, fundamentals, sentiment, and economic analysis. Not just lines on a chart, but zones validated by multi-discipline confluence.
Start Free — Get the Market of the WeekFree weekly report · No credit card · Upgrade anytime


