Nasdaq 100 Key Levels This Week — Support, Resistance & Confluence Zones
Nasdaq 100 key levels breakdown: support zones, resistance zones, confluence and price structure.

Structural Assessment
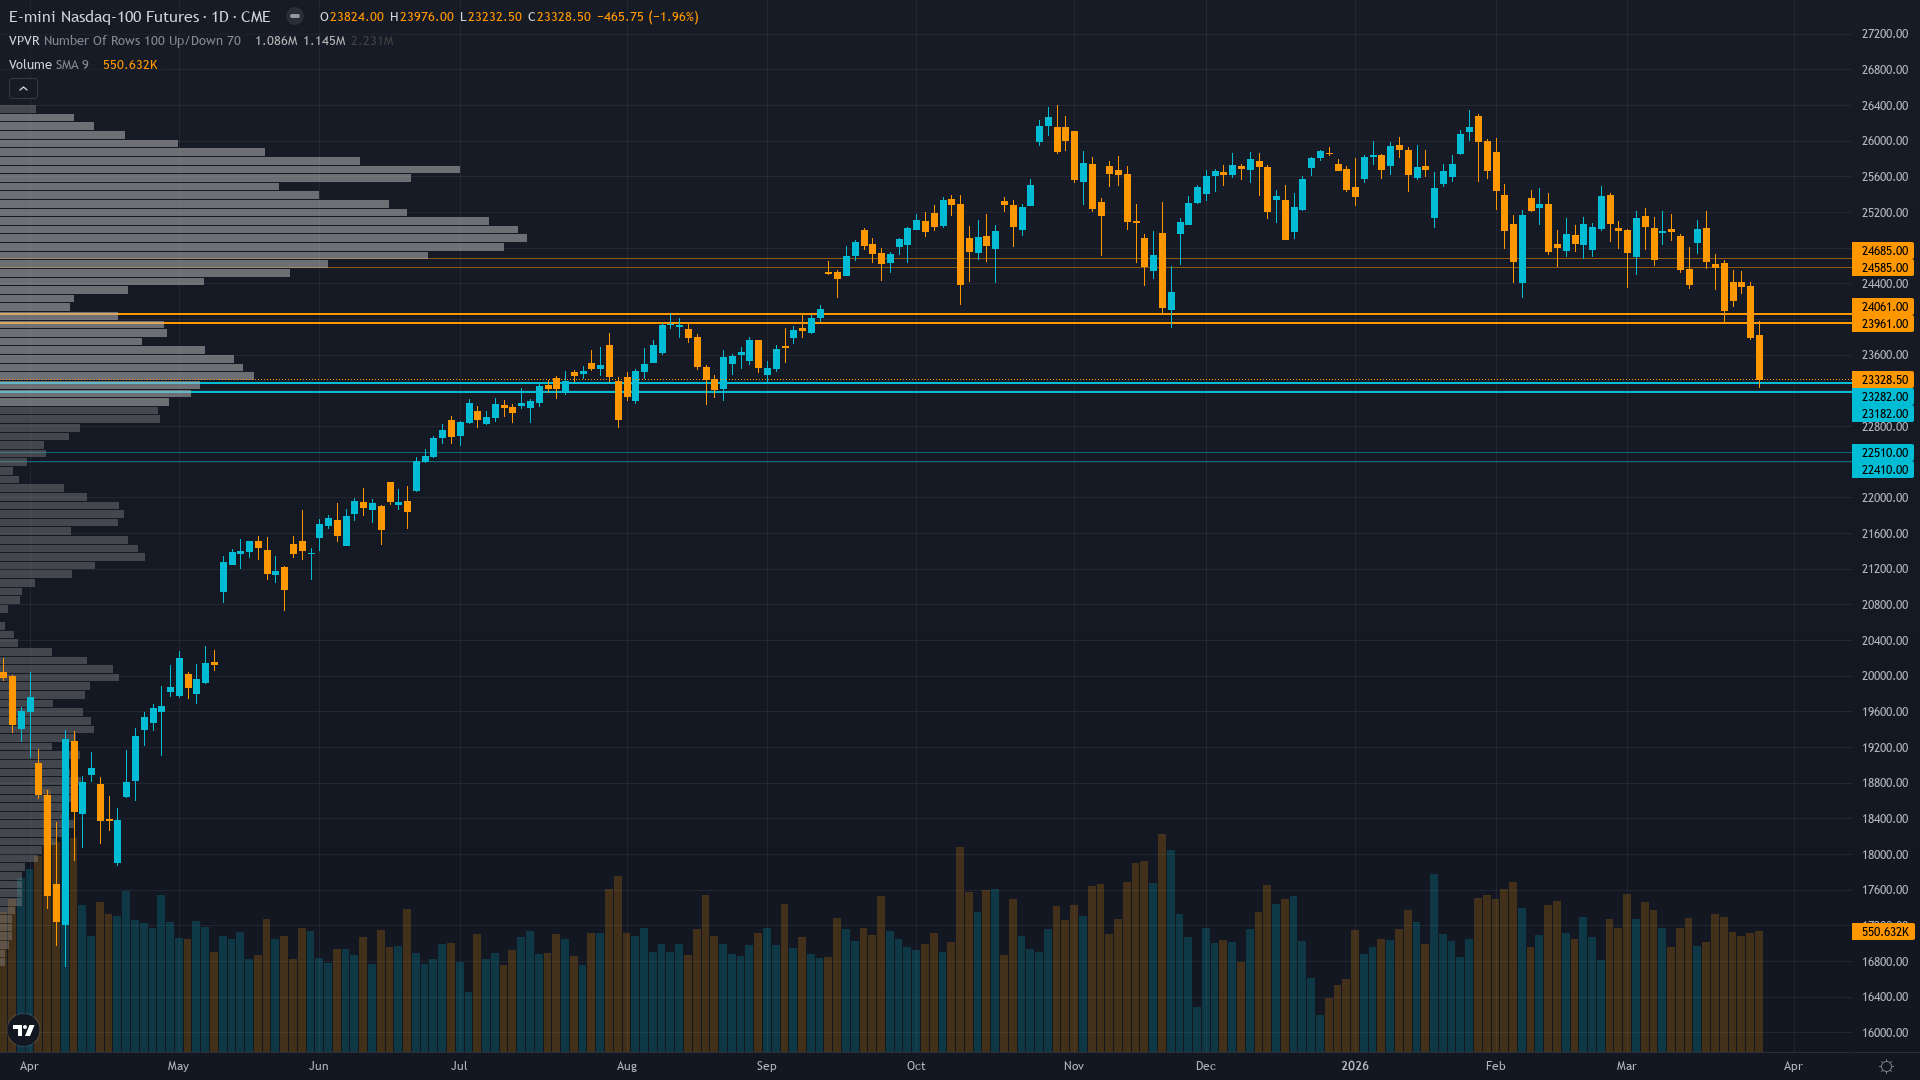
Nasdaq 100 sits at 23328.5, having shed 1.96% as bears maintain the upper hand. Nasdaq 100 futures is in a breaking down market state, requiring careful assessment of current conditions.
Severe breakdown with price at 23,328 decisively below 50-day MA (24,011) and 200-day MA (24,635), RSI 22.458 deeply oversold approaching capitulation but no bullish divergence yet, testing 23,232 intraday low as critical support
At 3/10, trend strength is subdued, suggesting the market lacks a clear directional mandate.
Support Architecture
Support levels for Nasdaq 100 are defined by zones of prior institutional demand. The depth and frequency of prior tests at these levels determines their likely strength.
The strength of support depends on the current RISK-OFF breakdown with VIX 31.05 well above 25 threshold, equities in confirmed downtrend below key moving averages, extreme fear evident but quarter-end mechanical selling (2 days away) amplifying distribution pressure regime and volume profile at each level.
Upside Barriers
Resistance levels above Nasdaq futures current price represent zones of historical supply. The significance of each level scales with the number of prior tests and the volume traded there.
The current breaking down regime influences how aggressively these resistance zones are likely to be tested and whether they hold or fold.
Confluence & Methodology
Confluence is the differentiator between a line on a chart and a level worth trading. For Nasdaq 100 futures, the zones with the highest conviction are those validated across technical, institutional, and derivatives dimensions simultaneously.
Extreme volatility at 78th percentile suggests 1.5-2.0x normal daily ranges; expect 400-500 point daily swings versus normal 200-300 ranges; breakouts above 24,011 or breakdowns below 23,232 carry elevated sustainability risk until VIX compresses below 70th percentile, requiring wider stops and defensive position sizing
Beyond Lines on a Chart
Our approach to key levels is designed to filter noise from signal. Six independent agents each assess the same price zones from different perspectives. A level confirmed by one discipline is interesting. A level confirmed by four or five is worth building a trade plan around.
This multi-discipline approach means the levels in our paid reports carry institutional-grade confluence — not just lines on a chart, but zones validated across every analytical dimension that matters.
Our paid reports include specific support and resistance levels identified by six specialist agents — technical structure, institutional positioning, options flow, fundamentals, sentiment, and economic analysis. Not just lines on a chart, but zones validated by multi-discipline confluence.
Start Free — Get the Market of the WeekFree weekly report · No credit card · Upgrade anytime


