Nasdaq 100 Key Levels This Week — Support, Resistance & Confluence Zones
Nasdaq 100 key levels breakdown: support zones, resistance zones, confluence and price structure.

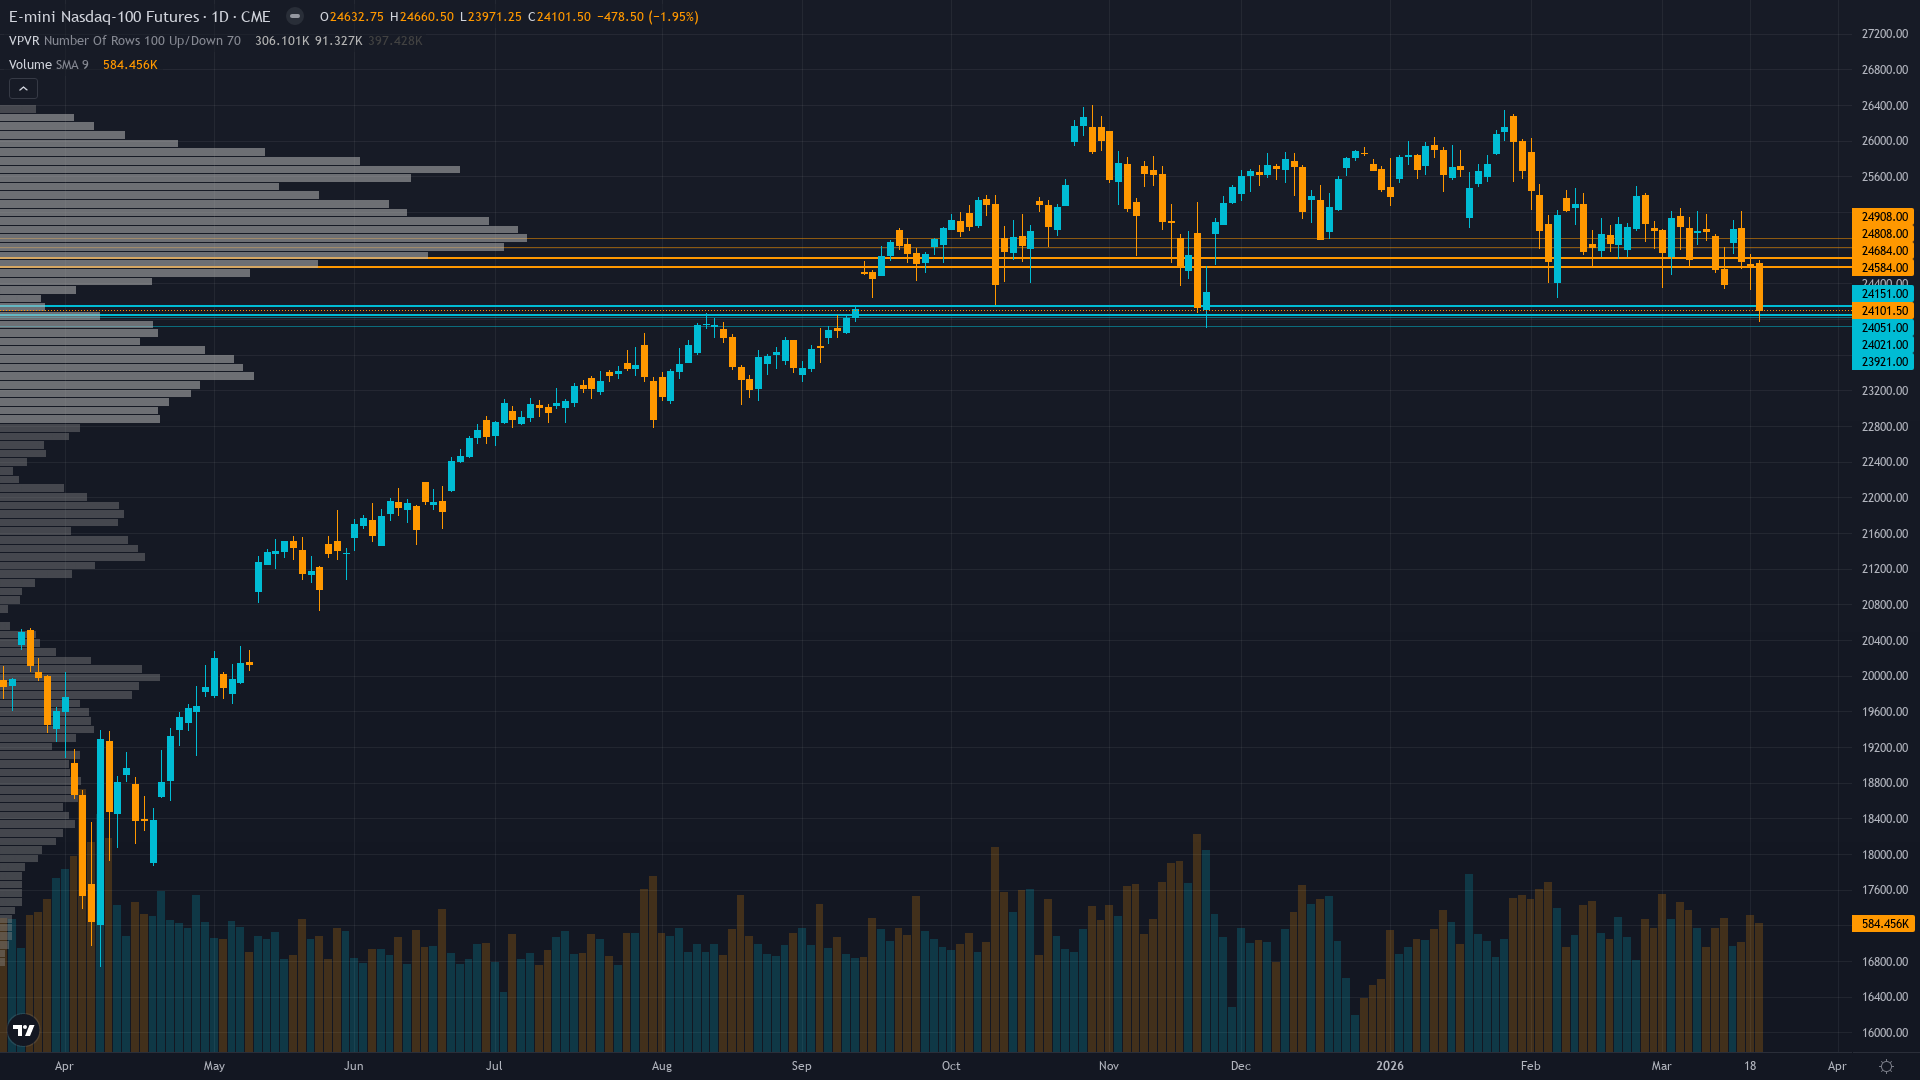
Price Architecture
Trading at 24101.5 after a 1.95% slide, Nasdaq 100 faces sustained selling interest. Nasdaq 100 futures is in a breaking down market state, requiring careful assessment of current conditions.
Confirmed breakdown below 50-day MA (24,634) and 200-day MA (24,858) with RSI 39.4 approaching oversold but not yet extreme, testing critical 0.786 Fib support at 24,378 with major support at 23,971
Trend strength is low at 3/10, indicating weak directional conviction and potential for range-bound behaviour.
Downside Protection
The downside architecture for tech futures features support zones rooted in prior buying activity. These are not arbitrary lines but areas where real capital has previously been committed.
The reliability of support under RISK-OFF bordering breakdown - VIX 26.78 above 25 threshold, equities in technical downtrend, geopolitical Iran war premium active, credit stable but equity risk appetite contracting sharply post-FOMC conditions is shaped by the interplay between volatility regime and historical volume at each level.
Resistance Zone Context
The upside path for NQ futures is marked by resistance zones where prior selling activity created structural barriers. Clearing these zones requires either strong momentum or a shift in the fundamental picture.
In the current market state, resistance zones remain key decision points.
Analytical Convergence
The most actionable levels for Nasdaq 100 are those where multiple analytical disciplines converge. When technical structure, institutional positioning, and options flow all point to the same zone, the probability of price reacting there increases meaningfully.
Elevated volatility at 70th percentile suggests 1.3-1.7x normal daily ranges; expect 320-420 point daily swings versus normal 200-250 ranges; breakouts above 24,634 or breakdowns below 24,101 carry higher sustainability risk until VIX compresses below 65th percentile, requiring wider stops and cautious position sizing
Our Multi-Agent Approach to Key Levels
The levels in our paid reports are generated by six specialist agents working in parallel. Technical analysis provides the structural framework, institutional data shows where capital is committed, options flow reveals hedging behaviour, fundamentals anchor levels to value, sentiment gauges crowd positioning, and economic analysis times the catalysts.
The output is a curated set of levels with institutional-grade validation — the kind of multi-dimensional analysis that hedge fund research desks produce, delivered at a fraction of the cost.
Our paid reports include specific support and resistance levels identified by six specialist agents — technical structure, institutional positioning, options flow, fundamentals, sentiment, and economic analysis. Not just lines on a chart, but zones validated by multi-discipline confluence.
Start Free — Get the Market of the WeekFree weekly report · No credit card · Upgrade anytime


