Nasdaq 100 Key Levels This Week — Support, Resistance & Confluence Zones
Nasdaq 100 key levels breakdown: support zones, resistance zones, confluence and price structure.
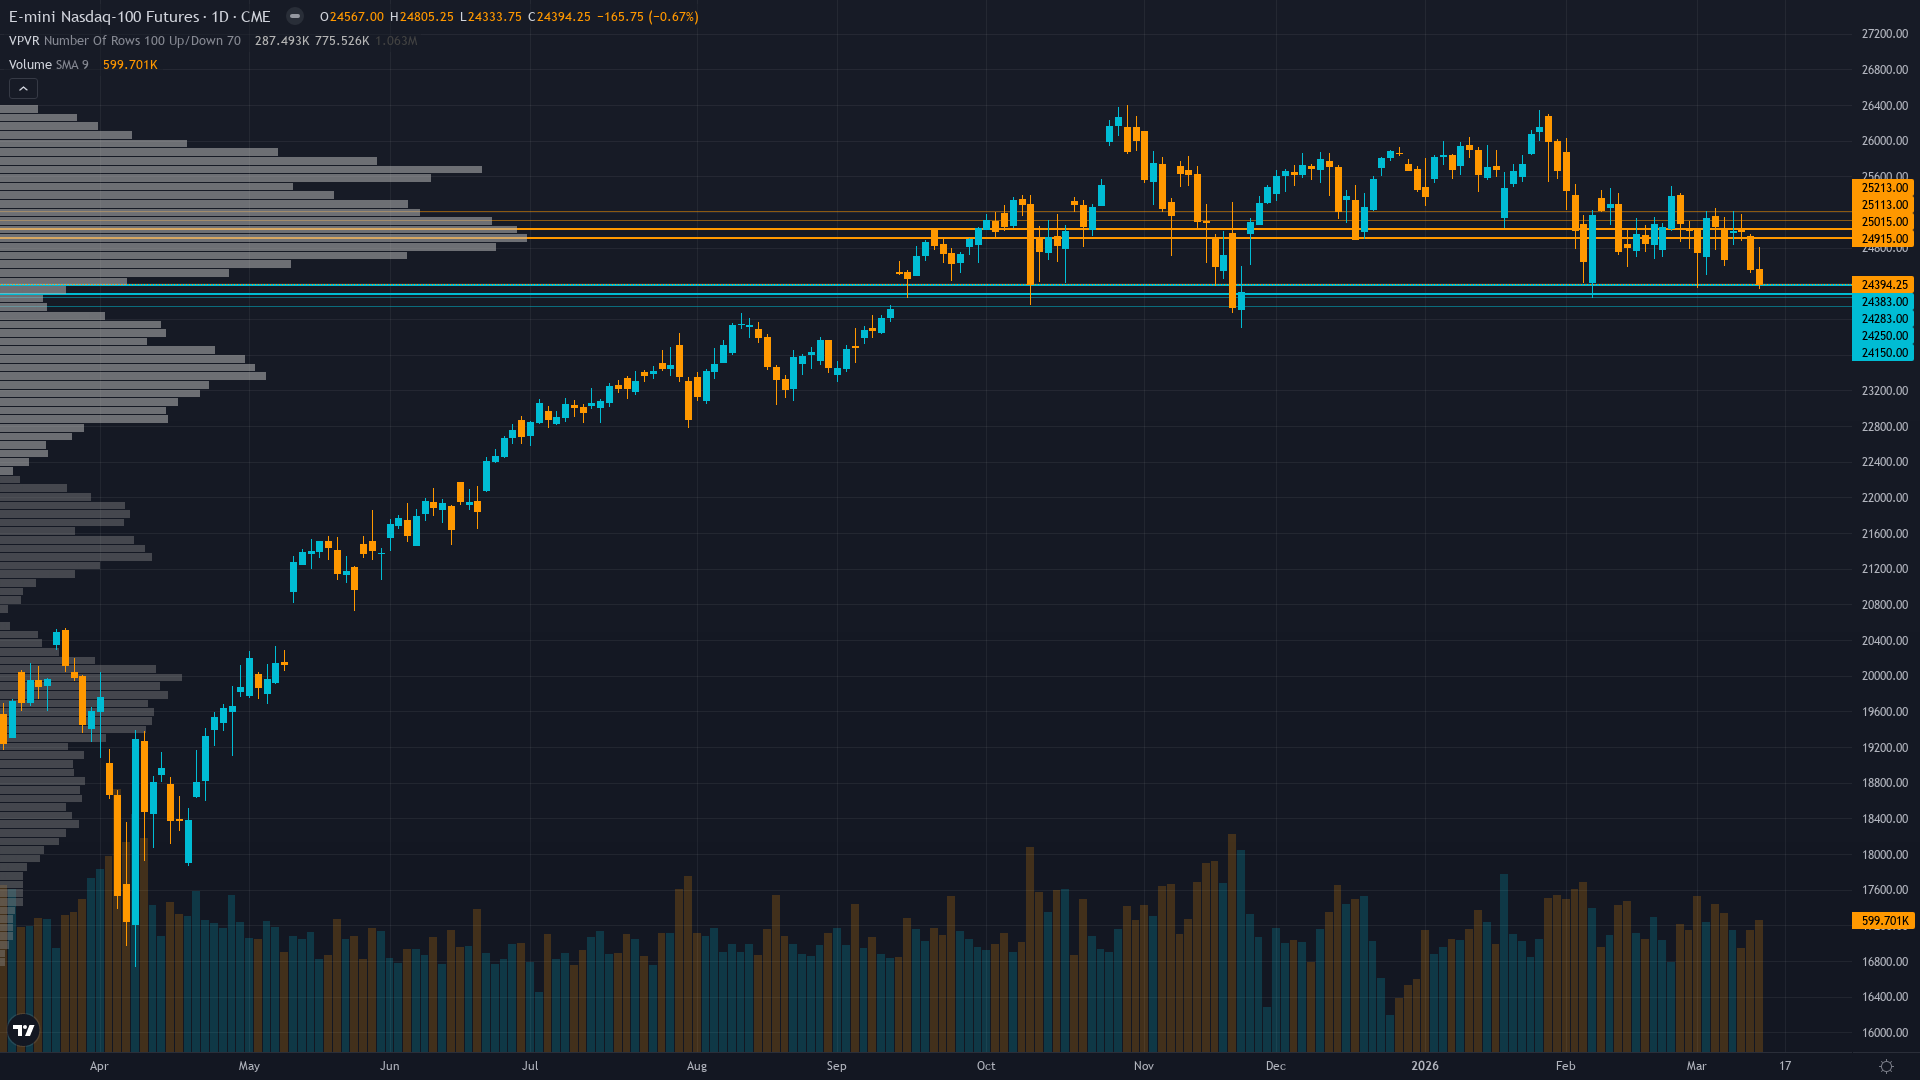
Current Price Structure
At 24394.25, Nasdaq 100 has eased 0.67% in a controlled retreat. Nasdaq 100 futures is range-bound and tightening, with decreasing volatility signalling a directional resolution ahead.
Bearish breakdown with price below 50-day and 200-day MAs, critical support at 24,411 tested, RSI 57 neutral (not oversold) indicating selling not yet exhausted despite multi-week lows
With trend strength at 4/10, the directional signal is present but far from decisive.
Support Zone Context
Below the current level, Nasdaq futures has structural support where demand has historically stepped in. The reliability of these zones depends on the volume profile and the number of prior interactions.
In the current TRANSITIONAL bordering RISK-OFF with VIX at 27.18 (well above 20 threshold), equities under pressure, but economic data mixed and no confirmed recession. Sentiment extremes and positioning conflicts create regime instability as March 18 FOMC meeting approaches. environment, support zones carry heightened risk of aggressive tests.
Ceilings & Supply Zones
Above current price, Nasdaq 100 futures faces resistance zones where selling pressure has historically intensified. These levels represent previous supply zones, profit-taking areas, or structural barriers that price needs to overcome for continuation.
How firmly these zones hold depends on the confluence of volume, prior reactions, and the current market regime.
Where Disciplines Converge
For Nasdaq futures, the levels that matter most are those confirmed by independent analytical approaches. When six different disciplines identify the same zone, the signal-to-noise ratio improves dramatically.
Elevated volatility at 70th percentile suggests 1.3-1.7x normal daily ranges; expect 320-420 point daily swings versus normal 200-250 ranges; breakouts above 24,965 or below 24,333 carry higher sustainability risk until VIX compresses below 65th percentile
How Macro Agent Desk Identifies Key Levels
Macro Agent Desk identifies key levels through a six-agent process. Each analytical discipline contributes independently — technical for structure, institutional for smart money interest, options for hedging activity, fundamentals for fair value context, sentiment for crowd positioning, and economics for catalyst timing.
What this means in practice: every key level in the full weekly report has been stress-tested across multiple independent analytical frameworks before it reaches the page.
Our paid reports include specific support and resistance levels identified by six specialist agents — technical structure, institutional positioning, options flow, fundamentals, sentiment, and economic analysis. Not just lines on a chart, but zones validated by multi-discipline confluence.
Start Free — Get the Market of the WeekFree weekly report · No credit card · Upgrade anytime


