Nasdaq 100 Forecast This Week — Outlook, Drivers & Key Levels
This week's Nasdaq 100 outlook: key drivers, volatility context, risk-opportunity assessment and the week ahead.

Current Market Picture
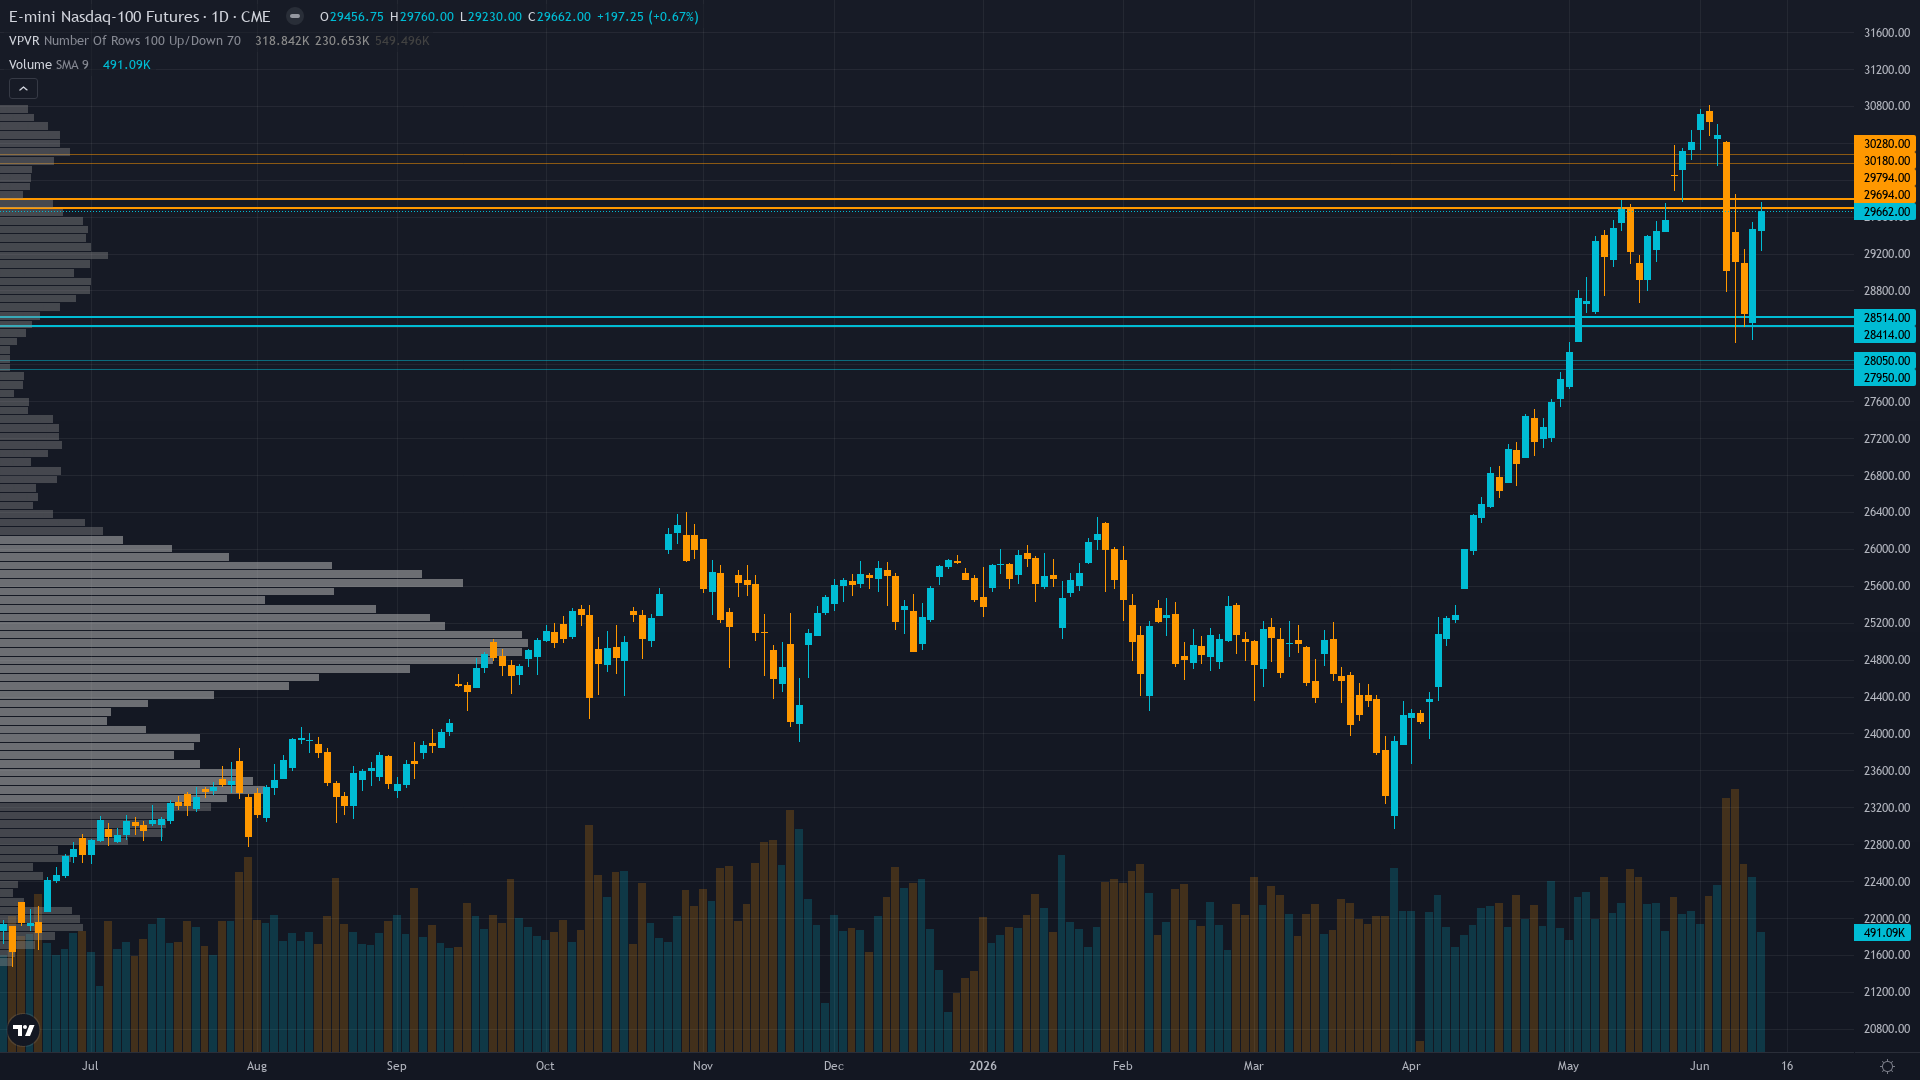
Trading at 29662 with a 0.67% uptick, Nasdaq 100 is drifting higher without strong conviction. The market in Nasdaq 100 futures is coiling, with narrowing price ranges suggesting stored energy that will eventually release.
Cautiously positioned ahead of June 17 FOMC with strategists acknowledging June 22 rebalancing flows provide structural support but defensive given expected removal of Fed easing bias and elevated valuations requiring execution
Key Drivers This Week
Primary driver: Miss reset NOT triggered (streak at 2, below 3-miss threshold) but synthesized signal at 0.7 falls below 1.0 Min Signal requirement per Rule 2, mandating NO CALL despite constructive discipline confluence (Sentiment +2.5, Institutional +1.5, Options +1.5) versus bearish (Economic -1.5, Technical -1.0)
Secondary factor: June 16-17 FOMC meeting (3 days away) expected to remove easing bias and shift to neutral stance per Forbes June 8 report, with markets pricing zero 2026 cuts and possible Q3 2027 hike creating tactical uncertainty as Fed trajectory reprices hawkish
Additional influence: Nasdaq-100 quarterly rebalancing June 22 (8 trading days away) adding 5 companies and removing 5, creating estimated mechanical buying pressure of $22-27 billion in QQQ and related trackers per Institutional agent, providing near-term structural support
Economic backdrop: Fed at 3.5-3.75% after April 28-29 hold with June 16-17 FOMC critical as Forbes June 8 reports expected removal of easing bias shifting to neutral stance, eliminating 2026 rate cut expectations per multiple sources, Manufacturing PMI 54.0 expansionary, hyperscaler AI capex at $600-725B 2026
Fundamental assessment: Moderately overvalued at 35.96x forward P/E (25% above 28.77x long-term average), Q2 earnings not until mid-July means fundamental weight minimal (0.05) in current window, no new catalyst identified
Price Structure
Contested zone between 50-day MA resistance at 29,535 and 200-day MA support at 29,320 with price at 29,662, RSI 57.15 neutral, intraday range 29,230-29,760 showing volatility but no breakout confirmation
Trend strength at 5/10 paints a picture of a market with some direction but lacking strong conviction.
Upside & Downside
Primary risk: Breakdown below 29,230-29,320 critical support zone (200-day MA) triggers acceleration toward 28,464 or lower as June 17 FOMC delivers hawkish language removing easing bias confirmed by Forbes June 8 report, combining with elevated 35.96x forward P/E requiring multiple compression if higher-for-longer rates persist (Probability: medium)
Primary opportunity: Hold above 29,320-29,535 support zone combined with June 22 Nasdaq-100 rebalancing mechanical flows ($22-27B estimated) drives recovery toward 30,000 resistance as June 17 FOMC provides balanced guidance and VIX compression from 19.44 continues toward normalized sub-17 range (Timeframe: 1-2 weeks as June 17 FOMC provides policy clarity and June 22 rebalancing flows materialize, with historical patterns showing 70% probability rebalancing creates 2-3% pre-event drift in addition stocks)
This week's edge: Market may be underweighting speed at which June 17 FOMC language shift from easing bias to neutral stance (confirmed by Forbes June 8 article) eliminates 2026 rate cut probability while overweighting near-term June 22 rebalancing mechanical flows that are now fully telegraphed creating potential sell-the-news dynamic; however, NO CALL appropriate as signal strength at 0.7 falls below 1.0 Min Signal threshold per Rule 2 despite acknowledging both contrarian sentiment setup and rebalancing structural support
Volatility Context
At the 72th percentile of its 90-day range, NQ futures volatility is running hot, creating both opportunity and risk for directional traders. Realised vol is trending higher across the curve, which tends to accompany transitional periods where the market is repricing risk.
High volatility at 72nd percentile suggests 1.4-1.7x normal daily ranges; expect 350-420 point daily swings versus normal 250-300 ranges; breakouts above 29,760 or breakdowns below 29,230 carry moderate sustainability risk until VIX compresses below 65th percentile
Week Ahead Outlook
The next major catalyst is June 16-17 FOMC meeting decision with rate announcement expected Tuesday June 17 at 2:00 PM ET, markets pricing 98%+ probability of hold at 3.5-3.75% but Forbes June 8 reports Fed likely to remove easing language and adopt neutral stance, materially shifting 2026 rate expectations from one cut to zero with possible Q3 2027 hike on Wednesday 17 June — a high-impact event that could materially shift the directional picture.
For tech futures, the balance between existing momentum and scheduled risk events sets the stage for the week ahead.
This analysis covers one dimension. Our full weekly report combines six specialist agents into a single actionable briefing with directional bias, key levels, and risk-opportunity matrix.
Start Free — Get the Market of the WeekFree weekly report · No credit card · Upgrade anytime