Nasdaq 100 Forecast This Week — Outlook, Drivers & Key Levels
This week's Nasdaq 100 outlook: key drivers, volatility context, risk-opportunity assessment and the week ahead.

This Week's Starting Point
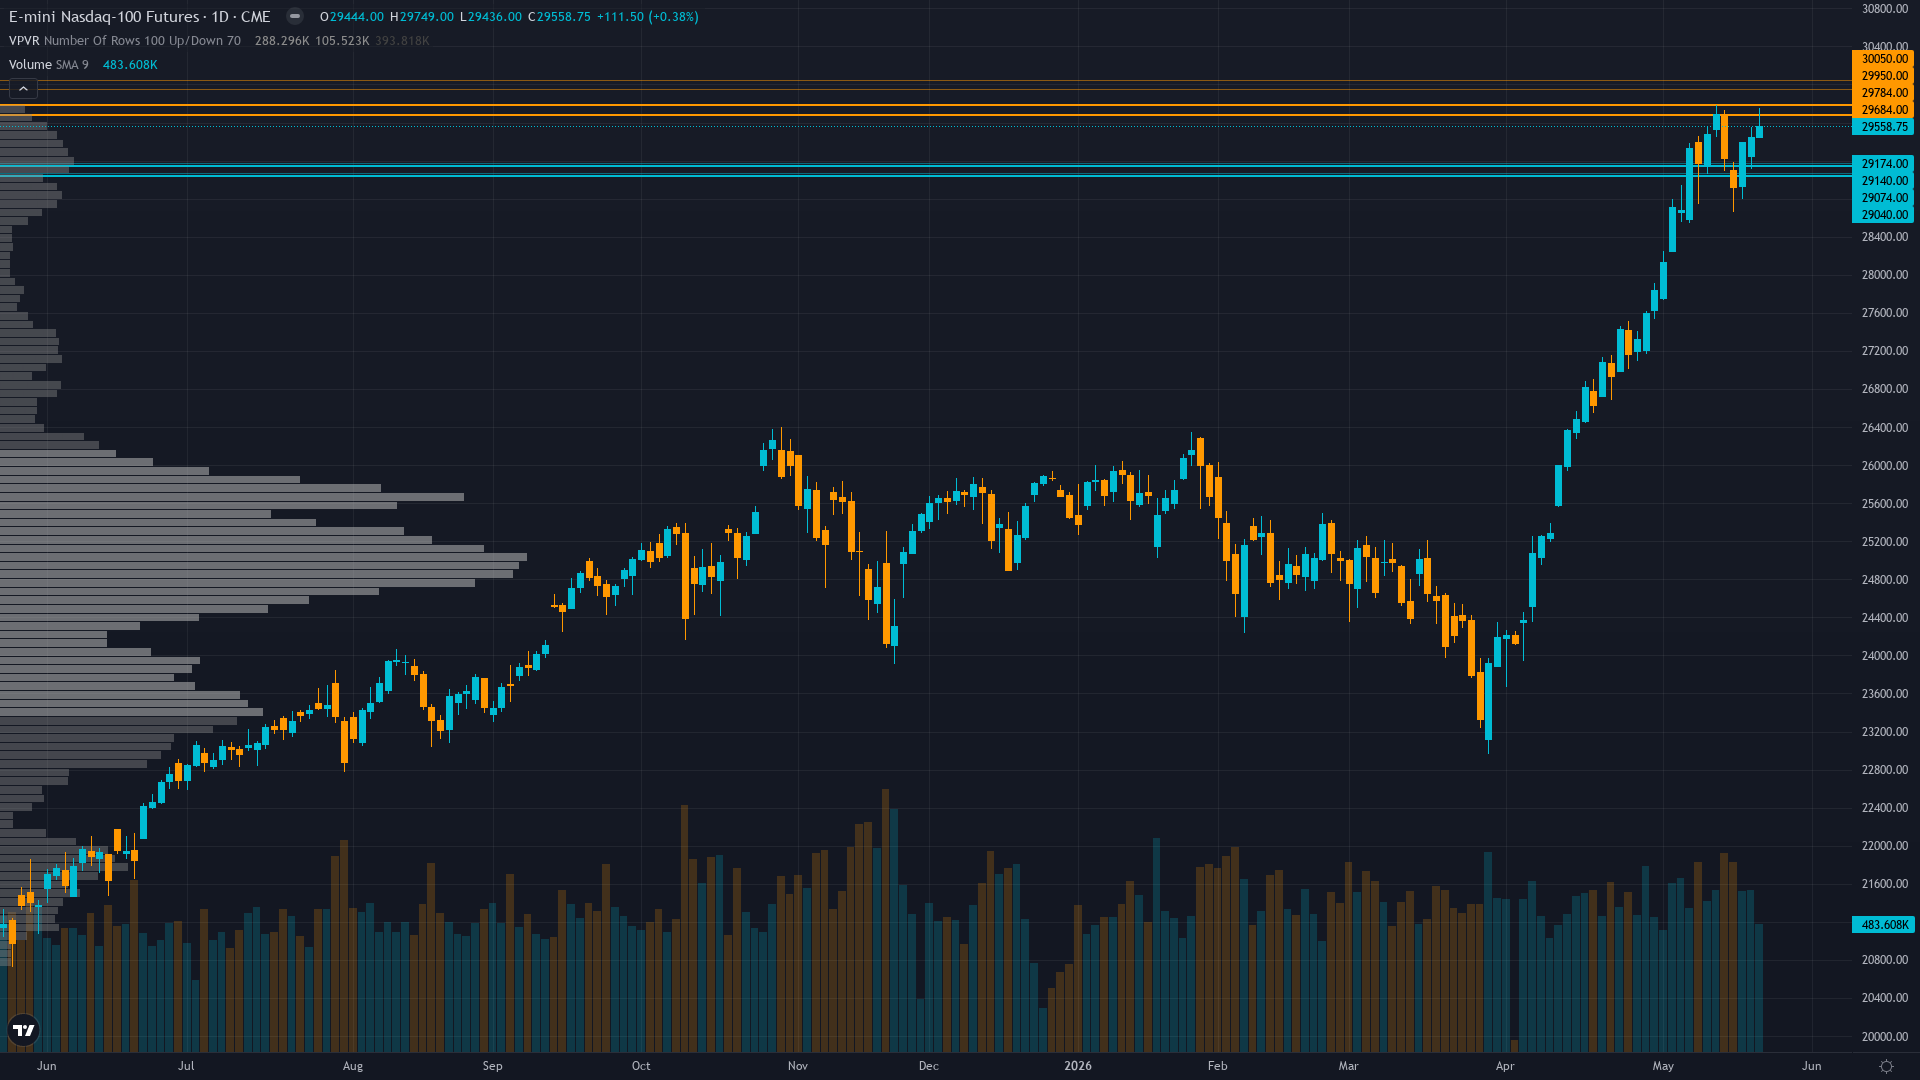
Nasdaq 100 sits at 29558.75 after a 0.38% gain — a quiet move higher without aggressive momentum. Price action in Nasdaq 100 futures has compressed into a consolidation pattern, typically a precursor to a directional breakout.
Constructively bullish on technical breakout confirmation above all-time highs and Q1 earnings validation with strategists forecasting 7-12% 2026 gains, though acknowledging near-term consolidation risk from overbought technicals and complacent sentiment requires tactical caution
Forces in Play
Primary driver: Technical breakout confirmed with NQ trading at 29,558 after setting new all-time high at 29,749 on May 22, 2026, extending above November 2025 peak of 26,182 while Manufacturing PMI surged to 55.3 (highest since 2022) providing economic validation
Secondary factor: Options market showing strong bullish positioning with VIX at 16.70 (well below 20 threshold) and equity put/call ratio at 0.49 indicating 2:1 call bias, while declining volatility premium supports continued upside in RISK-ON regime
Additional influence: Q1 2026 earnings season validated tech strength with forward P/E at 24.26 near fair value against 22.6% full-year growth expectations and $700B+ AI capex sustainability confirmed by hyperscalers, though elevated positioning creates near-term consolidation risk
Economic backdrop: Fed held at 3.5-3.75% after April 29 FOMC with dissent from Miran (preferred cut) signaling internal dovish pressure though no policy change, Manufacturing PMI surged to 55.3 in May (highest since May 2022) showing expansion momentum, ISM data beat expectations, Q1 hyperscaler earnings confirmed explosive AI capex growth with no signs of deceleration, next FOMC June 16-17
Fundamental assessment: Q1 2026 earnings season validated growth with 84% beat rate and aggregate +15.1% YoY growth, full-year 2026 EPS estimates revised UP from 15.6% to 22.6%, forward P/E at 24.26 near fair value against growth expectations, mega-cap tech confirmed $700B+ 2026 AI capex with revenue backlog surging (MSFT +99% YoY, GOOGL +185% YoY) supporting multi-year investment cycle sustainability
Technical Landscape
Powerful uptrend with price at 29,558 extending above new 52-week high of 29,749 set May 22, trading 352 points above 50-day MA (29,206) and 1,708 points above 200-day MA (27,850), RSI 65.1 bullish but not overbought, all moving averages aligned bullishly confirming trend strength with no bearish divergence present
Trend strength registers at 7/10, suggesting meaningful but not extreme directional bias.
Risk-Reward Assessment
Primary risk: Technical consolidation risk as RSI at 65.1 approaches overbought territory combined with equity put/call 0.49 extreme complacency and institutional positioning showing recent 5.7% OI decline suggesting profit-taking, creating vulnerability to pullback toward 29,206-27,850 support if momentum divergence develops or June FOMC delivers hawkish surprise (Probability: medium)
Primary opportunity: Technical breakout above prior all-time high of 26,182 confirmed on strong volume combining with RISK-ON regime persistence (VIX sub-17), Q1 earnings validating $700B+ AI capex sustainability with upward full-year growth revision to 22.6%, Manufacturing PMI at 4-year high, and Fed accommodative conditions drives sustained extension toward 30,000 psychological resistance as breakout momentum typically produces 3-5% follow-through within 10-15 trading days (Timeframe: 2-4 weeks as breakout extension historically produces follow-through moves within 10-15 trading days with 65-70% probability when supported by fundamental catalysts, June 16-17 FOMC providing next major directional clarity event)
This week's edge: Market may be underweighting the significance of Manufacturing PMI surge to 55.3 (highest since 2022) as genuine cyclical acceleration catalyst combining with confirmed technical breakout above 26,182 on strong volume which historically produces 3-5% follow-through within 10-15 days with 65-70% probability when supported by fundamental catalysts, while overweighting near-term complacency indicators (put/call 0.49, VIX 16.70) that can persist for weeks in powerful RISK-ON trends as breakout momentum attracts capital
Risk Environment
With vol at the 52th percentile over 90 days, NQ futures is in a measured regime that doesn't require unusual adjustments. Volatility is stable, with realised vol holding steady across timeframes. This equilibrium can persist but eventually resolves into expansion or contraction.
Normal volatility at 52nd percentile suggests 1.0-1.2x normal daily ranges; expect 250-300 point daily swings versus March extreme's 400-550 ranges; breakouts above 29,749 or pullbacks to 29,206 carry moderate sustainability as normalized vol allows tighter stops and standard position sizing versus defensive March stance
Looking Forward
All eyes turn to June 16-17 FOMC meeting decision with rate announcement, updated dot plot projections, and expected first meeting for new Fed Chair Kevin Warsh (pending Senate confirmation May 11), critical for assessing policy trajectory and tech valuation support as AI capex cycle sustainability faces scrutiny on Tuesday 16 June, which carries enough weight to force a decisive directional move.
The week ahead for Nasdaq 100 futures hinges on whether the prevailing consolidating regime can absorb the scheduled catalysts without a regime shift.
This analysis covers one dimension. Our full weekly report combines six specialist agents into a single actionable briefing with directional bias, key levels, and risk-opportunity matrix.
Start Free — Get the Market of the WeekFree weekly report · No credit card · Upgrade anytime


