Nasdaq 100 Forecast This Week — Outlook, Drivers & Key Levels
This week's Nasdaq 100 outlook: key drivers, volatility context, risk-opportunity assessment and the week ahead.

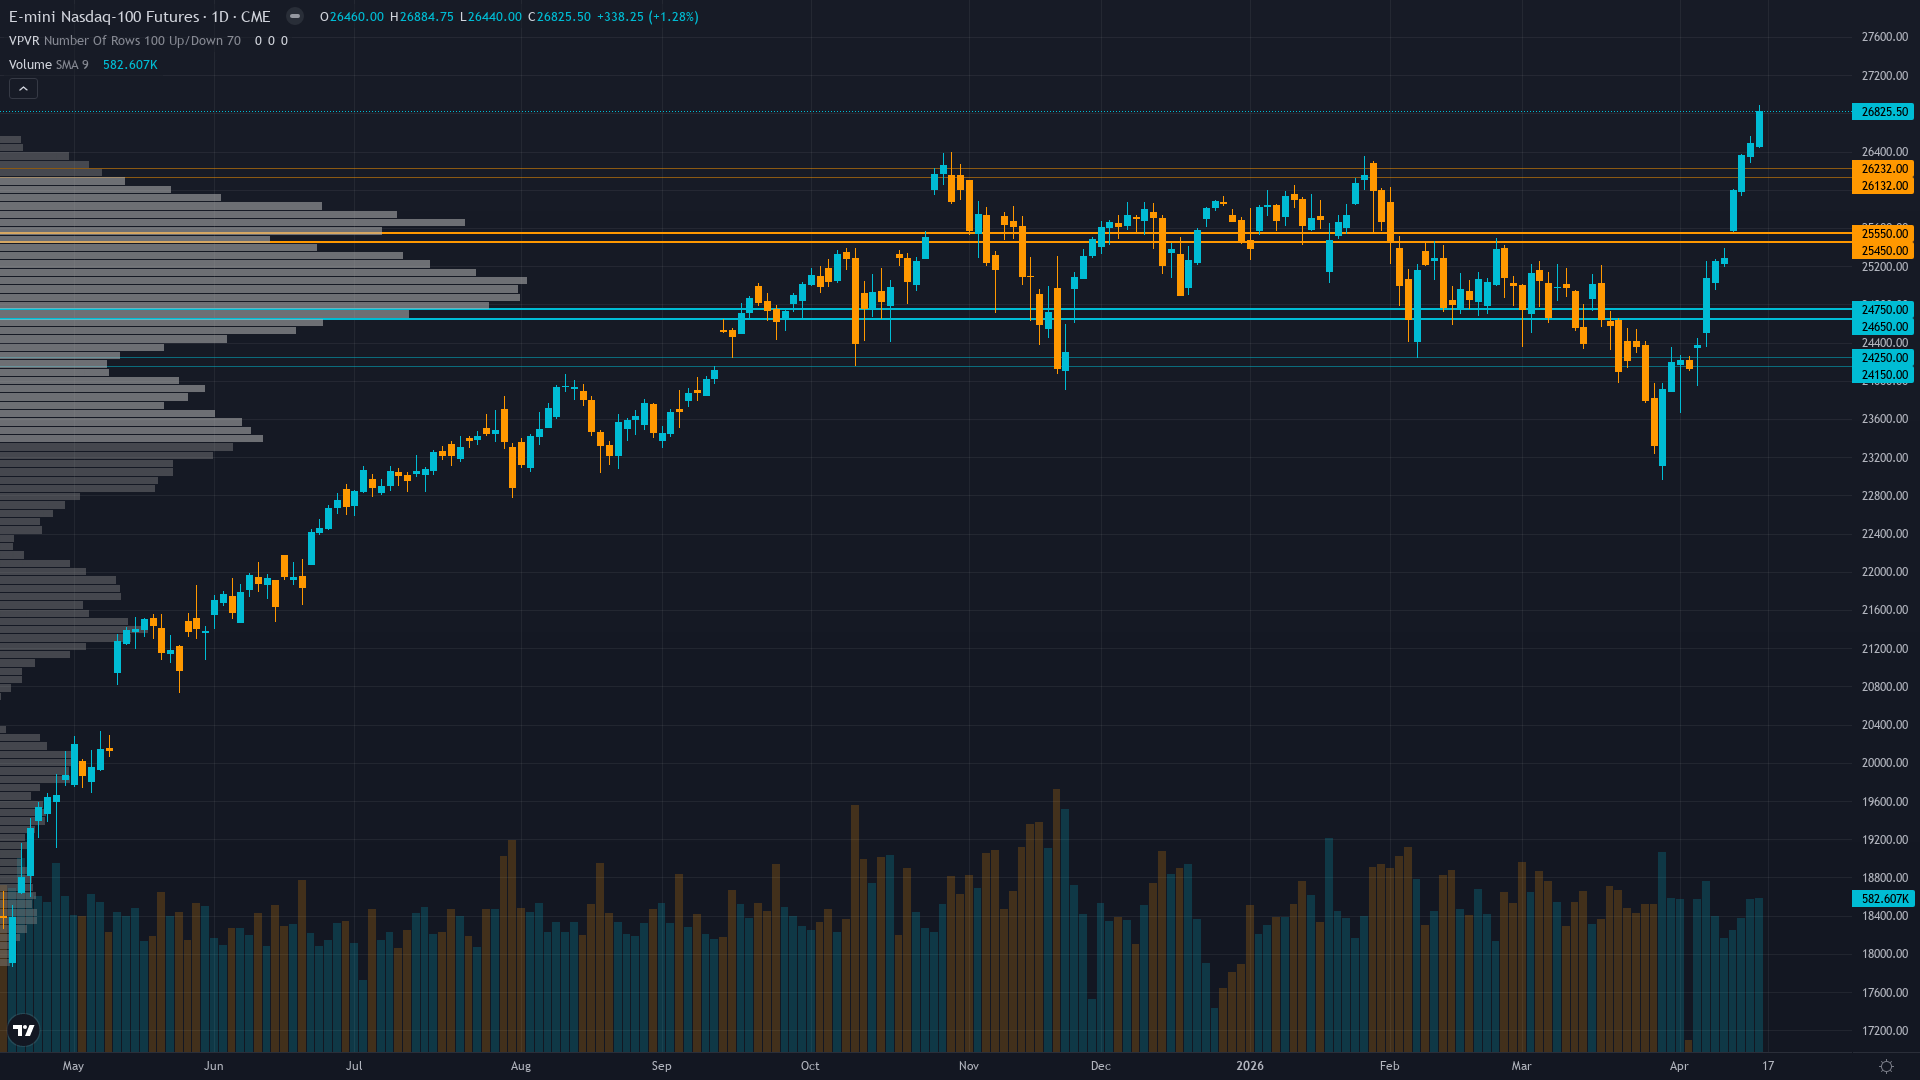
Where Things Stand
Nasdaq 100 is trading at 26841.25, down 0.05% in a measured pullback. Nasdaq 100 futures is consolidating, with price compressing into a narrower range as the market builds energy for its next move.
Constructively bullish on Q1 earnings validation and VIX normalization continuation driving further upside, acknowledging overbought technicals create near-term consolidation risk but maintaining positive trajectory bias
What's Driving Price
Primary driver: Miss reset requirement triggered after 4 consecutive MISSED calls (exceeding 3-miss threshold for EQUITY_INDEX category) mandating NEUTRAL bias per Rule 5, overriding otherwise constructive discipline signals from Technical (+2.5), Sentiment (+2.0), and Economic (+1.5) agents
Secondary factor: Strong uptrend confirmed with NQ breaking out above 26,200 resistance to current 26,841 (2.5% above all-time high of 26,182), RSI at 77.454 overbought but momentum intact, though extreme readings flag near-term consolidation risk
Additional influence: Q1 2026 earnings season actively underway with tech sector facing +23.7% earnings growth validation at elevated 36.96x forward P/E (51% premium to historical median), requiring execution to justify stretched valuations amid $610B AI capex commitments
Economic backdrop: Fed on hold at 3.5-3.75% after March 17-18 meeting with next FOMC April 28-29 (9 days away) expecting no change, Manufacturing PMI 52.4 showing expansion acceleration, ISM Services 54% healthy, AI capex cycle at $610B 2026 providing structural support
Fundamental assessment: Q1 2026 earnings season ongoing as of mid-April with S&P 500 aggregate +12.1% YoY growth and tech sector leading at +23.7% earnings growth, but NQ P/E 36.96 represents 51% premium to 24.47 historical median requiring execution to justify valuations
Chart Assessment
Powerful uptrend with price 1,350 points above 50-day MA (25,442) and 2,275 points above 200-day MA (24,526), breakout above 26,200 confirmed on closing basis, RSI 77.454 deeply overbought suggesting consolidation risk but MACD 269.52 buy signal intact
With trend strength at 7/10, there's a clear directional tilt but room for the move to develop further.
Risk & Opportunity
Primary risk: RSI at 77.454 deeply overbought combined with equity put/call ratio 0.41 (extreme complacency) creates elevated risk of near-term pullback or consolidation toward 26,440-25,500 support if momentum divergence develops or Q1 earnings disappoint on AI ROI concerns (Probability: medium)
Primary opportunity: Q1 earnings season validates +23.7% tech earnings growth expectations and AI capex sustainability combining with VIX compression continuation from March extremes drives sustained recovery toward 27,500-28,000 resistance as sentiment mean-reversion completes and seasonal patterns assert (Timeframe: 2-4 weeks as Q1 earnings season unfolds through early May providing fundamental catalyst clarity and VIX compression toward normalized sub-17 range historically follows 28-35 day post-spike patterns with 70% probability)
This week's edge: Resetting after 4 consecutive MISSED calls (exceeding 3-miss threshold) - thesis under review per mandatory Rule 5 requirement for EQUITY_INDEX category
Volatility Backdrop
NQ futures volatility at the 55th percentile reflects a balanced environment where standard risk parameters apply. Volatility remains anchored at current levels, with no clear signal of an imminent regime shift in either direction.
Normal volatility at 55th percentile suggests 1.0-1.2x normal daily ranges; expect 250-300 point daily swings versus extreme March environment's 400-550 ranges; breakouts above 27,000 or pullbacks to 26,440 carry moderate sustainability as normalized vol allows tighter stops and standard position sizing
The Week Ahead
April 28-29 FOMC meeting decision with rate announcement expected to hold at 3.5-3.75%, critical for assessing Fed policy trajectory and tech valuation support as Q1 earnings digest continues on Tuesday 28 April is a high-impact catalyst with the potential to redefine the near-term outlook entirely.
How Nasdaq 100 navigates the confluence of consolidating conditions and incoming data will determine whether the current directional thesis holds or breaks.
This analysis covers one dimension. Our full weekly report combines six specialist agents into a single actionable briefing with directional bias, key levels, and risk-opportunity matrix.
Start Free — Get the Market of the WeekFree weekly report · No credit card · Upgrade anytime


