Nasdaq 100 Forecast This Week — Outlook, Drivers & Key Levels
This week's Nasdaq 100 outlook: key drivers, volatility context, risk-opportunity assessment and the week ahead.

Current Market Picture
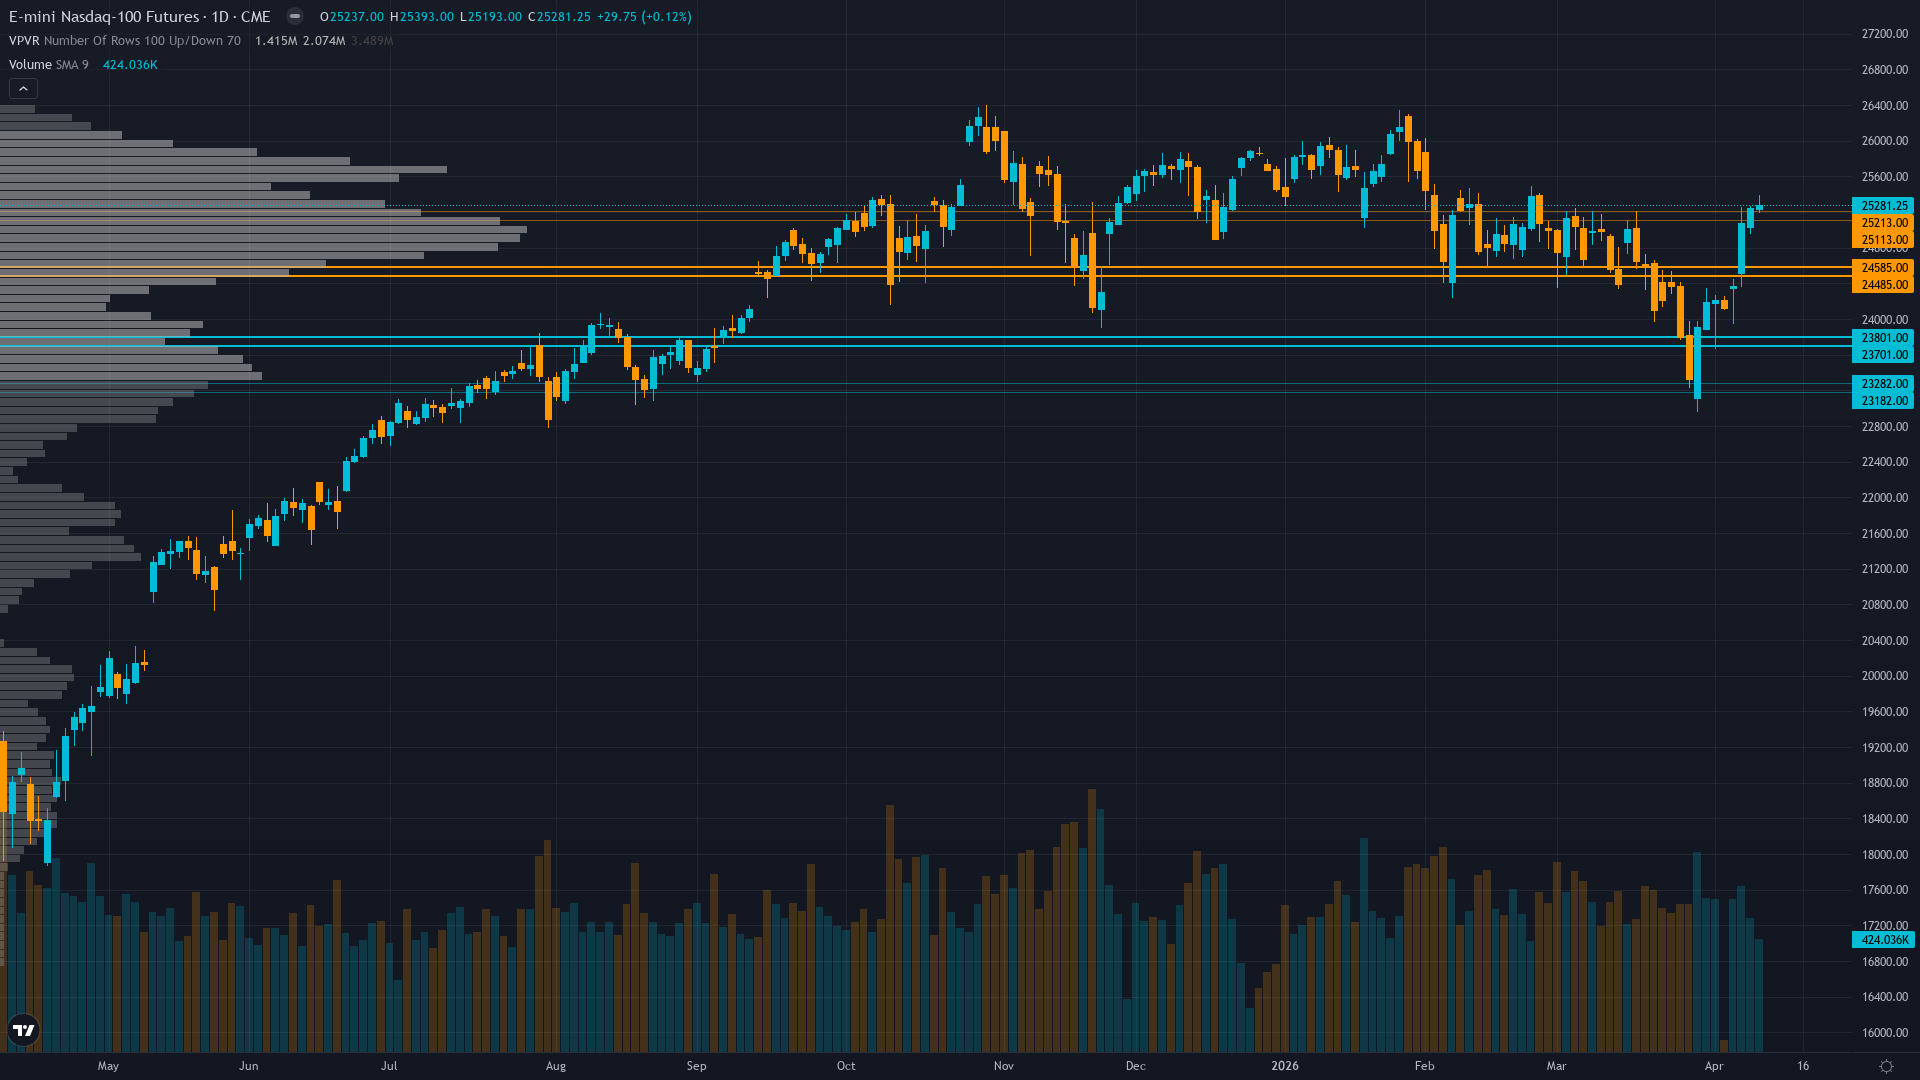
Trading at 25281.25 with a 0.12% uptick, Nasdaq 100 is drifting higher without strong conviction. The market in Nasdaq 100 futures is coiling, with narrowing price ranges suggesting stored energy that will eventually release.
Cautiously constructive acknowledging VIX compression and earnings season catalyst potential but defensive given March CPI shock shifting Fed expectations and elevated tech valuations requiring execution validation
Key Drivers This Week
Primary driver: Miss reset requirement triggered after 3 consecutive MISSED calls (April 10, April 3, March 27) mandating NEUTRAL bias per Rule 5, overriding otherwise constructive discipline signals (Technical +2, Sentiment +2, Options +1.5) versus bearish Economic -1.5 from March CPI spike
Secondary factor: March CPI surged +0.9% MoM (released April 10, 2026) driven by Iran war energy shock, materially shifting Fed policy trajectory with JPMorgan now expecting zero cuts in 2026 and possible Q3 2027 hike, removing key tech valuation support pillar
Additional influence: VIX compression from 23.87 to current 19.23 indicating volatility mean reversion completing while Q1 2026 earnings season imminent with tech sector facing +23.7% growth hurdle at elevated 35.43x forward PE requiring validation
Economic backdrop: Fed at 3.5-3.75% after March 18 hold with critical March CPI released April 10 showing +0.9% MoM acceleration (prior +0.3%) materially shifting rate cut expectations to zero for 2026 per JPMorgan with possible Q3 2027 hike, next FOMC May 6-7
Fundamental assessment: Tech fundamentals solid with Q1 2026 earnings expectations of +11.3% YoY growth for S&P 500 (tech higher at +23.7-27.1%) but facing intense scrutiny at 35.43x forward PE representing 44% premium to historical 24.46x median, requiring execution validation starting mid-April
Price Structure
Bullish daily trend with price at 25,281 above both 50-day MA (24,191) and 200-day MA (24,388), RSI 68.7 approaching overbought but not extreme, consolidating recent recovery from March 29 intraday low of 23,232 representing 8.8% rebound
Trend strength at 5/10 paints a picture of a market with some direction but lacking strong conviction.
Upside & Downside
Primary risk: Q1 earnings disappoint on AI infrastructure ROI concerns or guidance weakness combining with March CPI-driven hawkish Fed repricing triggering correction toward 24,200-24,000 major support as elevated 35.43x forward PE unwinds without growth validation and higher-for-longer rate trajectory increases discount rates on duration-sensitive tech (Probability: medium)
Primary opportunity: VIX compression from 60.13 March extreme to current 19.23 completing mean reversion combined with Q1 earnings season validating +23.7% tech growth expectations drives sustained recovery toward 26,182-26,500 resistance as sentiment capitulation from March (-17.70% AAII spread) fully reverses and volatility normalization attracts capital (Timeframe: 2-4 weeks as Q1 earnings season unfolds mid-April through early May providing fundamental catalyst clarity and VIX compression toward normalized sub-18 range historically follows 28-35 day post-spike patterns with 70% probability)
This week's edge: Resetting after 3 consecutive MISSED graded calls - thesis under review per mandatory Rule 5 requirement for EQUITY_INDEX category
Volatility Context
At the 65th percentile, NQ futures volatility sits in a normal range, neither compressed enough to signal a breakout nor elevated enough to demand caution. Realised vol is declining steadily, compressing into ranges that tend to snap when a catalyst breaks the equilibrium.
Normal volatility at 65th percentile suggests 1.1-1.4x normal daily ranges; expect 280-350 point daily swings versus normal 200-250 ranges; breakouts above 25,500 or breakdowns below 24,700 carry moderate sustainability as VIX approaches normalized regime, allowing tighter stops and standard position sizing versus March extreme environment
Week Ahead Outlook
The next major catalyst is Netflix Q1 2026 earnings report on April 16 after market close representing first major tech earnings release, followed by TSMC earnings preview April 16, providing initial validation signal for broader tech sector +23.7% growth expectations and AI monetization narrative sustainability on Thursday 16 April — a high-impact event that could materially shift the directional picture.
For tech futures, the balance between existing momentum and scheduled risk events sets the stage for the week ahead.
This analysis covers one dimension. Our full weekly report combines six specialist agents into a single actionable briefing with directional bias, key levels, and risk-opportunity matrix.
Start Free — Get the Market of the WeekFree weekly report · No credit card · Upgrade anytime


