Nasdaq 100 Forecast This Week — Outlook, Drivers & Key Levels
This week's Nasdaq 100 outlook: key drivers, volatility context, risk-opportunity assessment and the week ahead.

Current Market Picture
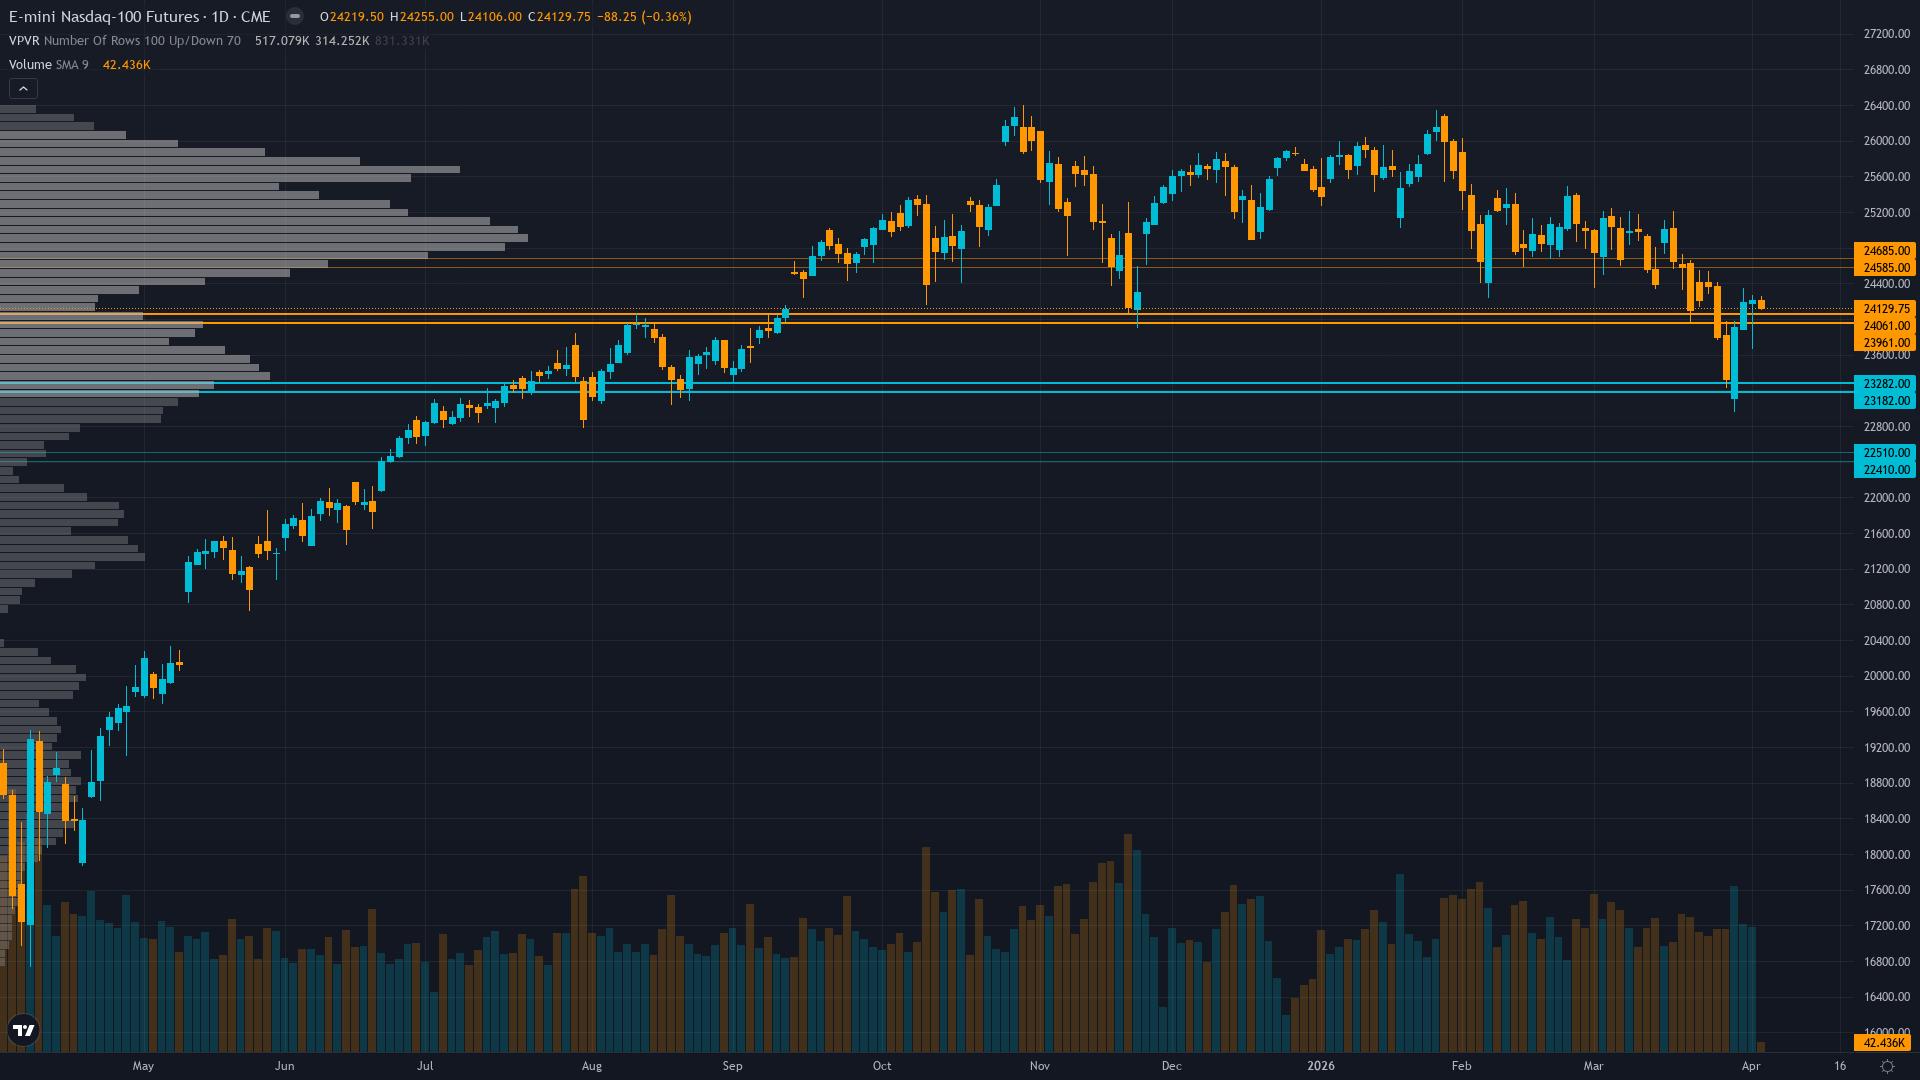
At 24129.75, Nasdaq 100 has eased 0.36% in a controlled retreat. The market in Nasdaq 100 futures is coiling, with narrowing price ranges suggesting stored energy that will eventually release.
Cautiously defensive acknowledging sentiment extremes create contrarian setup but waiting for Q1 earnings validation mid-April before committing directionally given elevated valuations requiring growth justification
Key Drivers This Week
Primary driver: Conflicting signals as March NFP beat (+178K vs +60K consensus) collides with VIX compression from 26.78 to 23.87 indicating fear subsiding, while NQ consolidates between 50-day MA (23,751) and 200-day MA (24,535) ahead of Q1 2026 earnings season starting mid-April
Secondary factor: Extreme sentiment capitulation from prior weeks (AAII -17.70% spread, VIX spike to 60.13 in March) reversing as volatility mean-reverts from elevated levels, creating tactical recovery but with institutional positioning remaining mid-range without conviction
Additional influence: Q1 2026 earnings season imminent (starting mid-April per search results) with tech sector expected +23.7% earnings growth requiring validation of 35.2x forward P/E and $650B AI capex sustainability concerns
Economic backdrop: Fed at 3.5-3.75% on hold with no FOMC meeting this week; March NFP beat at +178K vs +60K consensus (released April 3) but volatile series creates uncertainty rather than clear trend after February's -133K revised print
Fundamental assessment: Outside earnings season with Q1 2026 results not until mid-April per searches; elevated 35.2x P/E requires +23.7% to +27.1% Q1 earnings validation but fundamental weight minimal (0.05) in current pre-earnings window
Price Structure
Contested no-man's land between 50-day MA at 23,751 (support) and 200-day MA at 24,535 (resistance) with RSI 55.79 neutral, neither overbought nor oversold, price at 24,130 showing indecision
Trend strength at 5/10 paints a picture of a market with some direction but lacking strong conviction.
Upside & Downside
Primary risk: Q1 earnings disappoint on AI spending ROI concerns or guidance weakness triggering breakdown below 23,751 critical 50-day MA support toward 23,232 intraday low as elevated 35.2x P/E unwinds without growth validation (Probability: medium)
Primary opportunity: Sentiment mean-reversion from March extremes (AAII -17.70% spread, VIX compression from 60.13 to 23.87) continues driving recovery toward 24,535-25,163 resistance as Q1 earnings season validates +23.7% tech earnings growth expectations and volatility normalization completes (Timeframe: 2-3 weeks as VIX compression toward 20-22 normalized range completes and April earnings catalysts provide directional clarity, with historical 70% probability of sentiment reversal after extreme bearish readings)
This week's edge: Market may be underweighting speed of volatility mean-reversion from March extremes (VIX from 60.13 to 23.87 in 6 days) and extreme sentiment capitulation (-17.70% AAII spread) that historically reverses within 3-7 days with 70% probability, while overweighting near-term technical breakdown risk; however, NO CALL appropriate as signal strength insufficient (-0.3 < 1.0 threshold) and conviction after penalties (2) falls below minimum viable level (5) in contested range lacking catalyst strong enough to override structural uncertainty
Volatility Context
At the 70th percentile of its 90-day range, NQ futures volatility is running hot, creating both opportunity and risk for directional traders. Realised vol is declining steadily, compressing into ranges that tend to snap when a catalyst breaks the equilibrium.
Elevated volatility at 70th percentile suggests 1.3-1.7x normal daily ranges; expect 320-420 point daily swings versus normal 200-250 ranges; breakouts above 24,535 or breakdowns below 23,751 carry higher sustainability risk until VIX compresses below 65th percentile, requiring wider stops and defensive position sizing
Week Ahead Outlook
The next major catalyst is Q1 2026 earnings season beginning mid-April with Nasdaq Inc (NDAQ) reporting April 23 as bellwether for mega-cap tech constituents facing scrutiny on AI infrastructure ROI and $650B capex sustainability on Thursday 23 April — a high-impact event that could materially shift the directional picture.
For tech futures, the balance between existing momentum and scheduled risk events sets the stage for the week ahead.
This analysis covers one dimension. Our full weekly report combines six specialist agents into a single actionable briefing with directional bias, key levels, and risk-opportunity matrix.
Start Free — Get the Market of the WeekFree weekly report · No credit card · Upgrade anytime


