Nasdaq 100 Forecast This Week — Outlook, Drivers & Key Levels
This week's Nasdaq 100 outlook: key drivers, volatility context, risk-opportunity assessment and the week ahead.

Where Things Stand
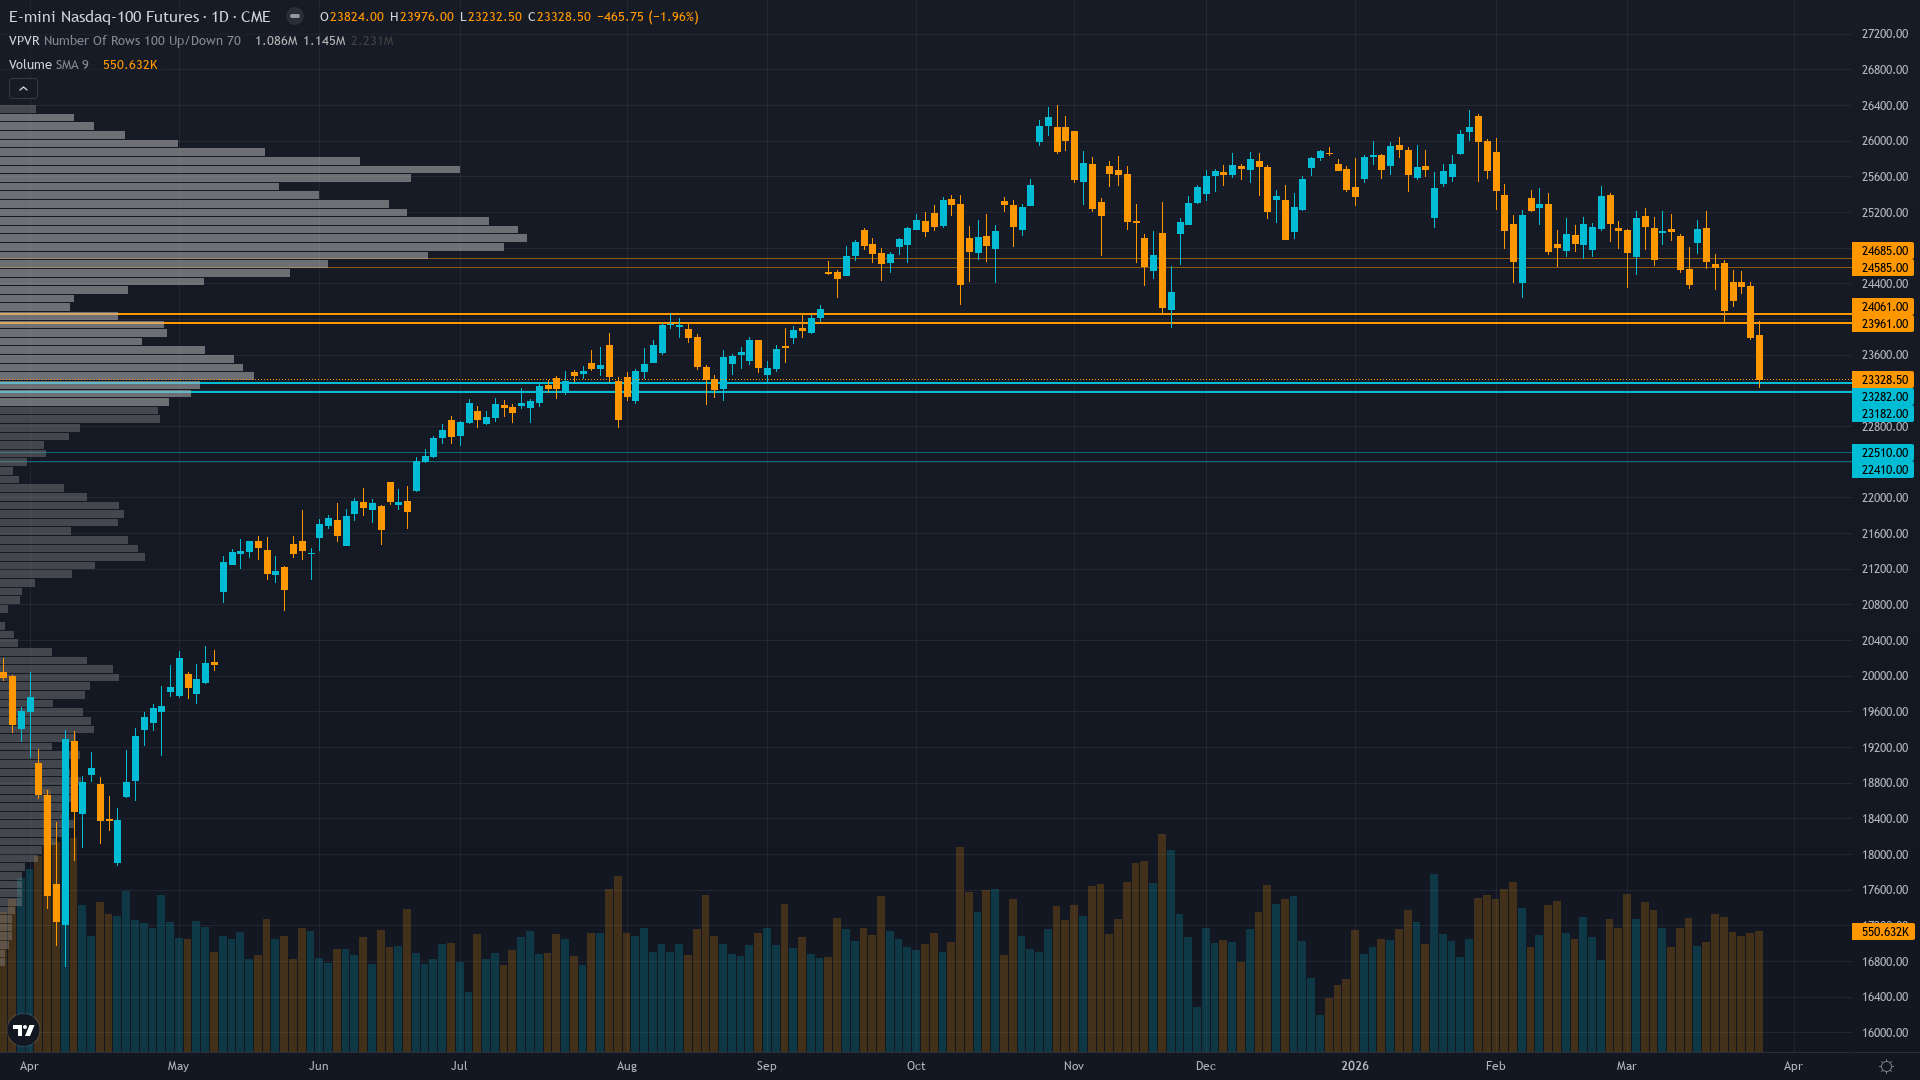
Nasdaq 100 is trading at 23328.5, down 1.96% as selling pressure weighs on price. Nasdaq 100 futures is in a breaking down market state, requiring careful assessment of current conditions.
Defensive and fearful with 49.8% AAII bears positioned for further downside, but institutional positioning moderately bearish rather than capitulating suggests tactical caution without full panic while quarter-end mechanical selling dominates near-term flow dynamics
What's Driving Price
Primary driver: VIX spike to 31.05 marking extreme fear regime as NQ plunged from 23,918 open to 23,232 intraday low on March 29, extending breakdown from post-FOMC selloff despite extreme bearish sentiment creating contrarian potential
Secondary factor: Technical breakdown accelerating with RSI at 22.458 approaching sub-20 capitulation territory and price decisively below both 50-day MA (24,011) and 200-day MA (24,635) confirming death cross structure
Additional influence: Extreme sentiment capitulation with AAII showing 49.8% bears versus 32.1% bulls (-17.7% spread) historically associated with 70% reversal probability within 3-7 days but quarter-end March 31 creating forced selling pressure
Economic backdrop: Fed held at 3.5-3.75% on March 18 with hawkish conditional guidance from Powell eliminating dovish repricing opportunity; February NFP -92k disaster (released March 6) signals labor deterioration but no fresh catalysts this week ahead of April 4 March NFP
Fundamental assessment: Outside earnings season with Q1 2026 results not until mid-April; tech sector Q1 earnings growth expectations of 27.1% YoY provide structural support but elevated 35.7x forward P/E requires validation, fundamental weight minimal (0.05) in current window
Chart Assessment
Severe breakdown with price at 23,328 decisively below 50-day MA (24,011) and 200-day MA (24,635), RSI 22.458 deeply oversold approaching capitulation but no bullish divergence yet, testing 23,232 intraday low as critical support
With trend strength at only 3/10, any directional bias is thin and easily disrupted.
Risk & Opportunity
Primary risk: Breakdown below 23,232 critical intraday support triggers capitulation selling toward 22,460 major support (1.618 Fib extension) as quarter-end window dressing (March 31, 2 days away) forces additional institutional distribution from underperforming funds (Probability: medium)
Primary opportunity: Extreme bearish sentiment (AAII 49.8% bears at -17.7% spread versus +6.5% historical average) reverses within 3-5 days as VIX compression from 31.05 accelerates post-quarter-end and critical support at 23,232-23,600 holds, driving relief rally toward 24,635-25,163 resistance (Timeframe: 3-7 days post-quarter-end (April 1-7) as sentiment mean-reversion patterns and VIX normalization historically occur with 70% probability following extreme readings, particularly after mechanical selling pressure completes)
This week's edge: Market may be underweighting extreme sentiment capitulation (AAII -17.7% spread at levels that historically reverse within 3-7 days with 70% probability) while overweighting near-term quarter-end mechanical selling and technical breakdown that tests support with historical hold rates; however, NO CALL appropriate as signal strength insufficient (0.8 < 1.0 threshold) and conviction after penalties (4) falls below minimum viable level (5) in binary setup lacking directional edge
Volatility Backdrop
NQ futures is in a high-volatility environment (78th percentile over 90 days), where position sizing discipline becomes critical. Volatility expansion is underway, suggesting the market is moving into a phase of heightened activity and wider ranges.
Extreme volatility at 78th percentile suggests 1.5-2.0x normal daily ranges; expect 400-500 point daily swings versus normal 200-300 ranges; breakouts above 24,011 or breakdowns below 23,232 carry elevated sustainability risk until VIX compresses below 70th percentile, requiring wider stops and defensive position sizing
The Week Ahead
Quarter-end rebalancing and window dressing flows on March 31 (Tuesday) creating forced selling pressure from underperforming funds closing positions to reduce tracking error and career risk exposure before Q1 close on Tuesday 31 March is a high-impact catalyst with the potential to redefine the near-term outlook entirely.
How Nasdaq 100 navigates the confluence of breaking down conditions and incoming data will determine whether the current directional thesis holds or breaks.
This analysis covers one dimension. Our full weekly report combines six specialist agents into a single actionable briefing with directional bias, key levels, and risk-opportunity matrix.
Start Free — Get the Market of the WeekFree weekly report · No credit card · Upgrade anytime


