Nasdaq 100 Forecast This Week — Outlook, Drivers & Key Levels
This week's Nasdaq 100 outlook: key drivers, volatility context, risk-opportunity assessment and the week ahead.
Market Overview
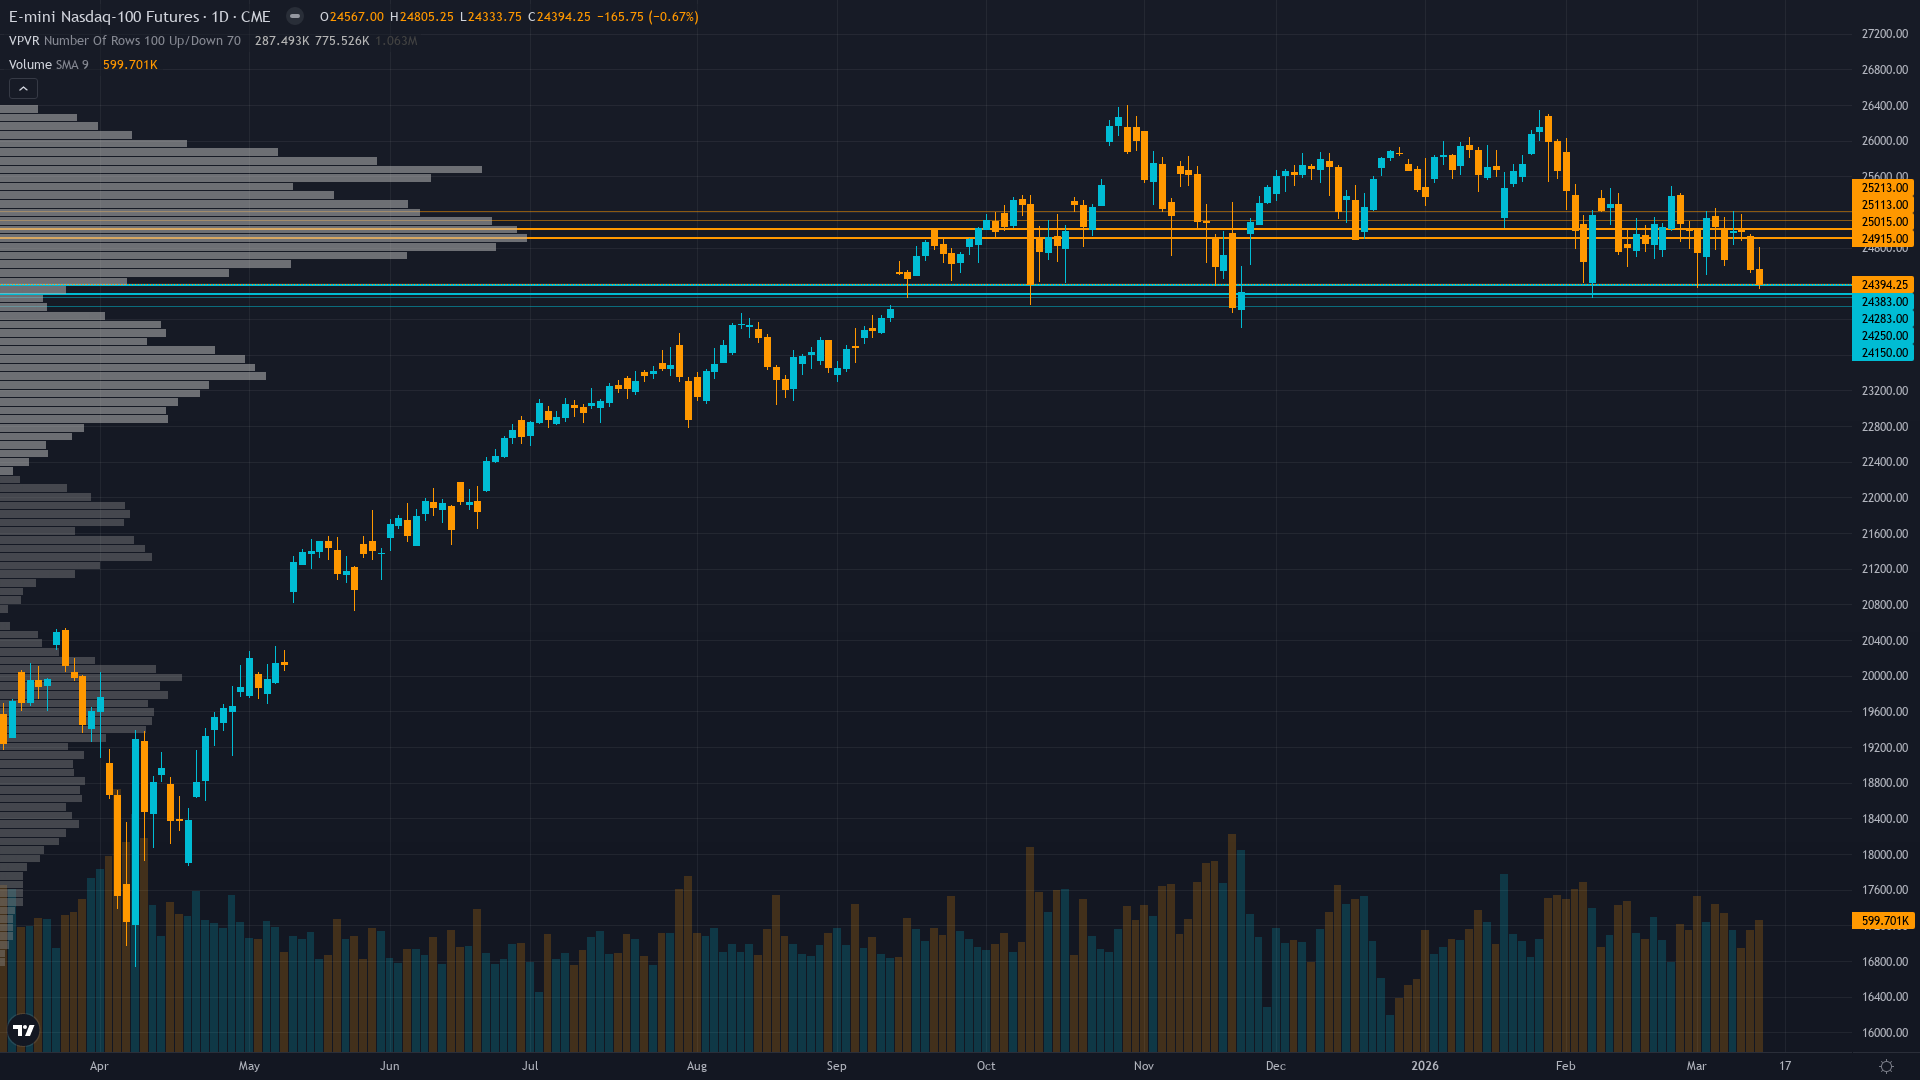
At 24394.25, Nasdaq 100 has eased 0.67% in a controlled retreat. Nasdaq 100 futures is range-bound and tightening, with decreasing volatility signalling a directional resolution ahead.
Cautiously defensive awaiting March 18 FOMC clarity with extreme bearish sentiment acknowledged but technical deterioration and elevated volatility preventing aggressive positioning either direction
This Week's Catalysts & Drivers
Primary driver: Extreme bearish sentiment (AAII 46.4% bearish vs 31.9% bullish) creating contrarian opportunity conflicting with elevated VIX at 27.18 and deteriorating technicals below both key moving averages ahead of March 18 FOMC meeting
Secondary factor: VIX regime shift with 52% monthly surge to 27.18 indicating sustained fear but compressing from intraday highs suggesting peak panic may have passed
Additional influence: Technical breakdown structure with NQ trading at 24,394 below both 50-day MA (24,965) and 200-day MA (25,163) creating bearish alignment but RSI at 57 shows no oversold capitulation
Economic backdrop: Fed holding at 3.5-3.75% with March 18 FOMC meeting 3 days away showing 92%+ probability of hold; February jobs weak (-92k) but mixed data overall; AI capex cycle ($700B 2026) structurally supportive but not weekly catalyst
Fundamental assessment: Between earnings seasons with Q1 2026 earnings not until mid-April; elevated valuations at 33.44x forward PE with +23.7% Q1 earnings growth expected require validation but fundamental weight minimal (0.05) outside earnings windows
Technical Picture
Bearish breakdown with price below 50-day and 200-day MAs, critical support at 24,411 tested, RSI 57 neutral (not oversold) indicating selling not yet exhausted despite multi-week lows
At 4/10, trend strength is middling — enough to suggest a lean, but not enough to trade with high confidence.
Bull & Bear Case
Primary risk: March 18 FOMC delivers hawkish hold with fewer projected 2026 cuts than market expects, combining with quarter-end window dressing flows (16 days away) to trigger accelerated selling toward 24,000-24,200 major support as duration-sensitive tech faces higher-for-longer repricing (Probability: medium)
Primary opportunity: Extreme bearish sentiment (AAII -14.5% bull-bear spread vs +6.5% historical) represents capitulation-level reading that historically reverses within 1-2 weeks, combining with VIX compression from intraday highs and critical support hold at 24,333-24,411 to fuel relief rally toward 25,163-25,500 resistance zone (Timeframe: 3-10 days post-FOMC as sentiment extremes mean-revert and VIX compression accelerates if Fed maintains balanced stance)
This week's edge: Market may be underweighting the extreme nature of sentiment capitulation (AAII bears 15 points above historical norm, VIX up 52% monthly) which historically reverses within 1-2 weeks, while simultaneously overweighting near-term FOMC binary risk that could resolve dovishly; however, NO CALL is appropriate as signal strength insufficient and catalyst timing creates two-way risk beyond analysis edge
Volatility Regime
Volatility for NQ futures sits at the 70th percentile over 90 days — an elevated regime that demands wider risk parameters and faster decision-making. The vol trend is down, with contraction across timeframes creating the kind of coiled conditions that historically resolve explosively.
Elevated volatility at 70th percentile suggests 1.3-1.7x normal daily ranges; expect 320-420 point daily swings versus normal 200-250 ranges; breakouts above 24,965 or below 24,333 carry higher sustainability risk until VIX compresses below 65th percentile
What to Watch
The March FOMC meeting decision with rate announcement at 2:00 PM ET followed by press conference; market pricing 92%+ probability of hold at 3.5-3.75% range but dot plot updates and forward guidance critical for tech valuations on Wednesday 18 March stands as the week's primary risk event — high-impact and capable of overriding the existing technical and sentiment setup.
The interplay between consolidating market conditions and upcoming catalysts will define this week's trading landscape for Nasdaq futures.
This analysis covers one dimension. Our full weekly report combines six specialist agents into a single actionable briefing with directional bias, key levels, and risk-opportunity matrix.
Start Free — Get the Market of the WeekFree weekly report · No credit card · Upgrade anytime


