Nasdaq 100 COT & Institutional Positioning — Smart Money Analysis
Nasdaq 100 institutional positioning: COT data, sentiment analysis and smart money flow assessment.

The Institutional Landscape
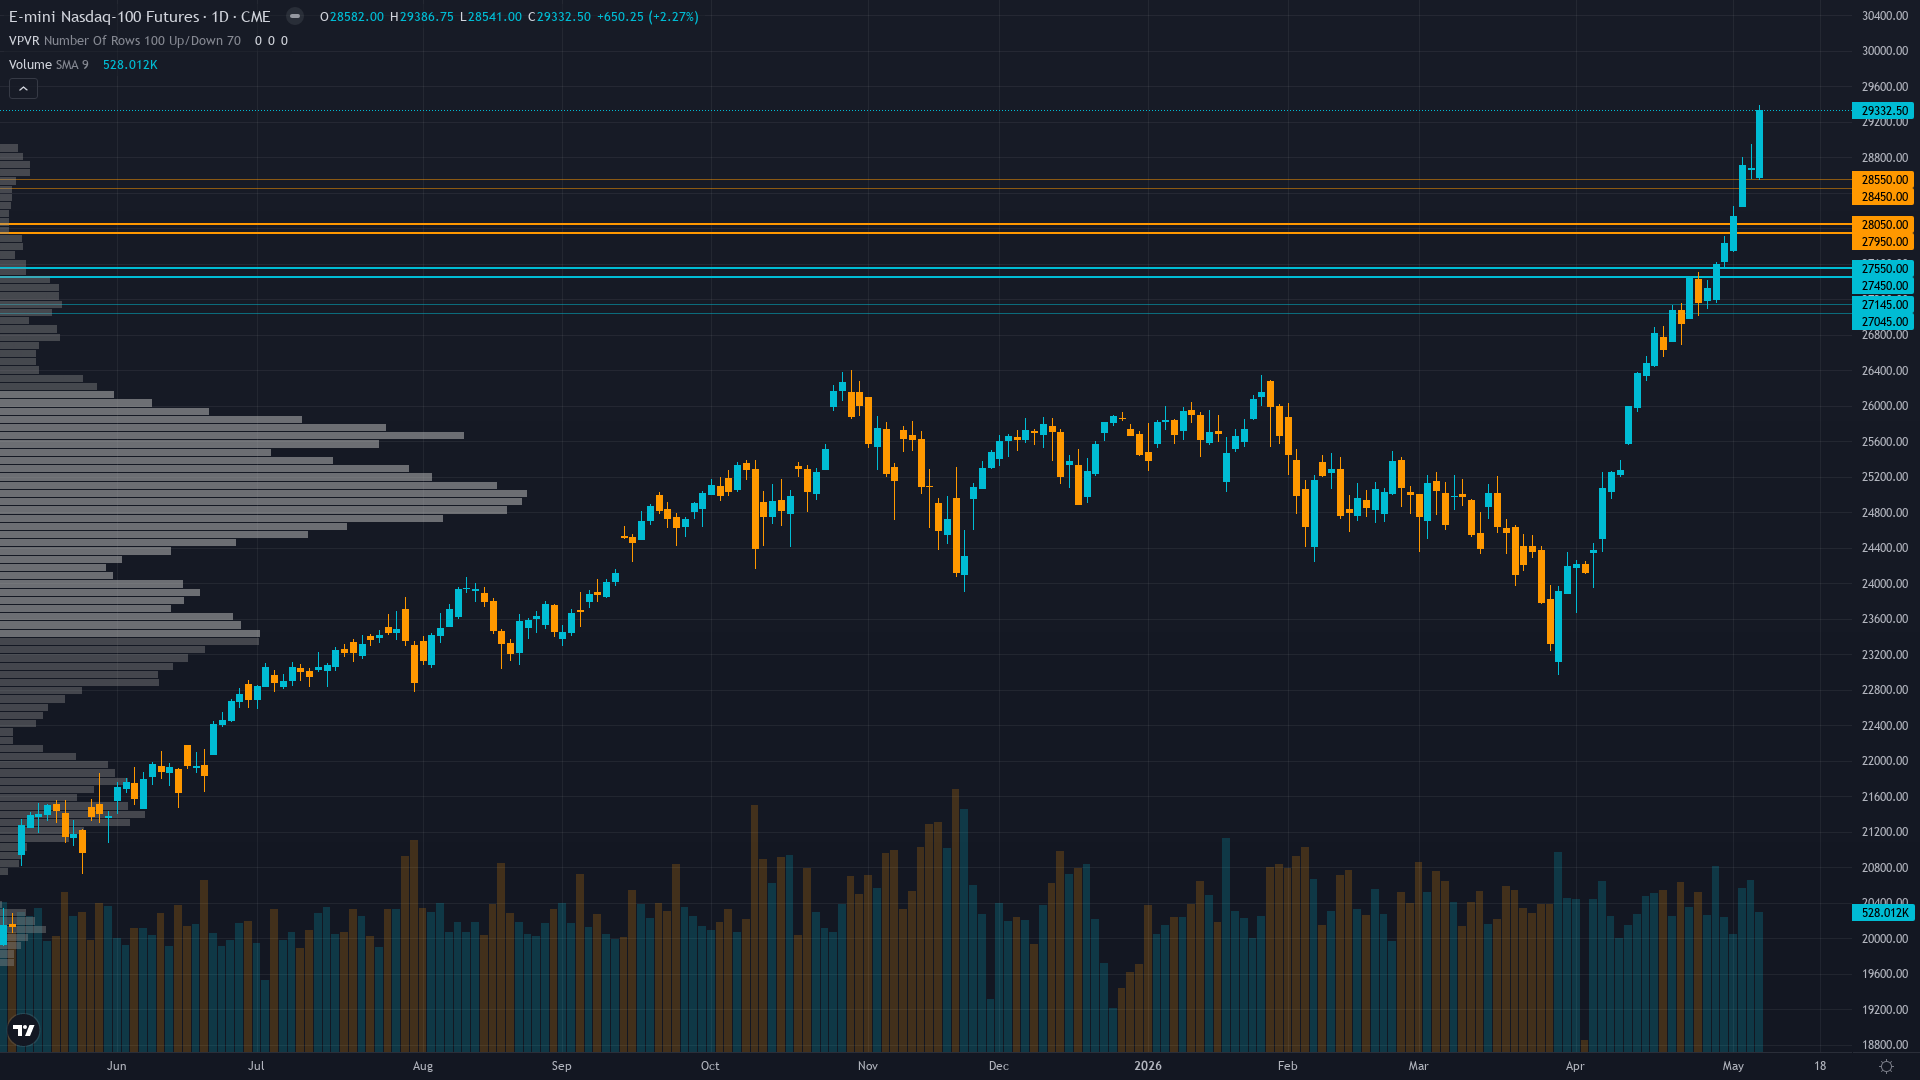
Nasdaq 100 stands at 29332.5, having rallied 2.27% as bulls press their advantage.
Moderately bullish with open interest at 289.69K contracts and building long positioning into breakout highs, though positioning approaching 70-80th percentile creates potential reversal risk if momentum stalls, QQQ ETF showing $16.03B annual inflows confirming institutional accumulation trend
Market Sentiment
The sentiment picture for Nasdaq 100 futures is evenly split, providing no contrarian signal in either direction. The next move will likely be event-driven.
What Options Markets Show
VIX at 17.19 fully normalized from March 60.13 extreme indicating complete fear dissipation and sustained calm expected, equity put/call ratio 0.53 very low showing 2:1 call bias with minimal hedging demand (complacency signal but also confirming bullish positioning), NQ June options IV 19.96% moderate and stable, declining volatility premium supports continued upside as fear resolution complete
Consensus vs MAD View
Primary driver: Powerful technical breakout to new 52-week high at 29,386.75 on May 10, 2026, extending 5.4% above prior November 2025 all-time high of 27,917 with Q1 2026 earnings season validating 22.6% full-year growth (revised up from 15.6% in January) and $700B+ AI infrastructure capex sustainability confirmed by mega-cap hyperscalers
The Bottom Line on Positioning
The positioning mosaic for tech futures combines neutral sentiment with stable volatility conditions. Trend strength is elevated at 8/10, indicating strong directional conviction in current price action. Taken together, institutional behaviour, crowd psychology, and derivatives data frame the setup heading into the new week.
This analysis covers one dimension. Our full weekly report combines six specialist agents into a single actionable briefing with directional bias, key levels, and risk-opportunity matrix.
Start Free — Get the Market of the WeekFree weekly report · No credit card · Upgrade anytime