Nasdaq 100 COT & Institutional Positioning — Smart Money Analysis
Nasdaq 100 institutional positioning: COT data, sentiment analysis and smart money flow assessment.

Where Institutions Stand
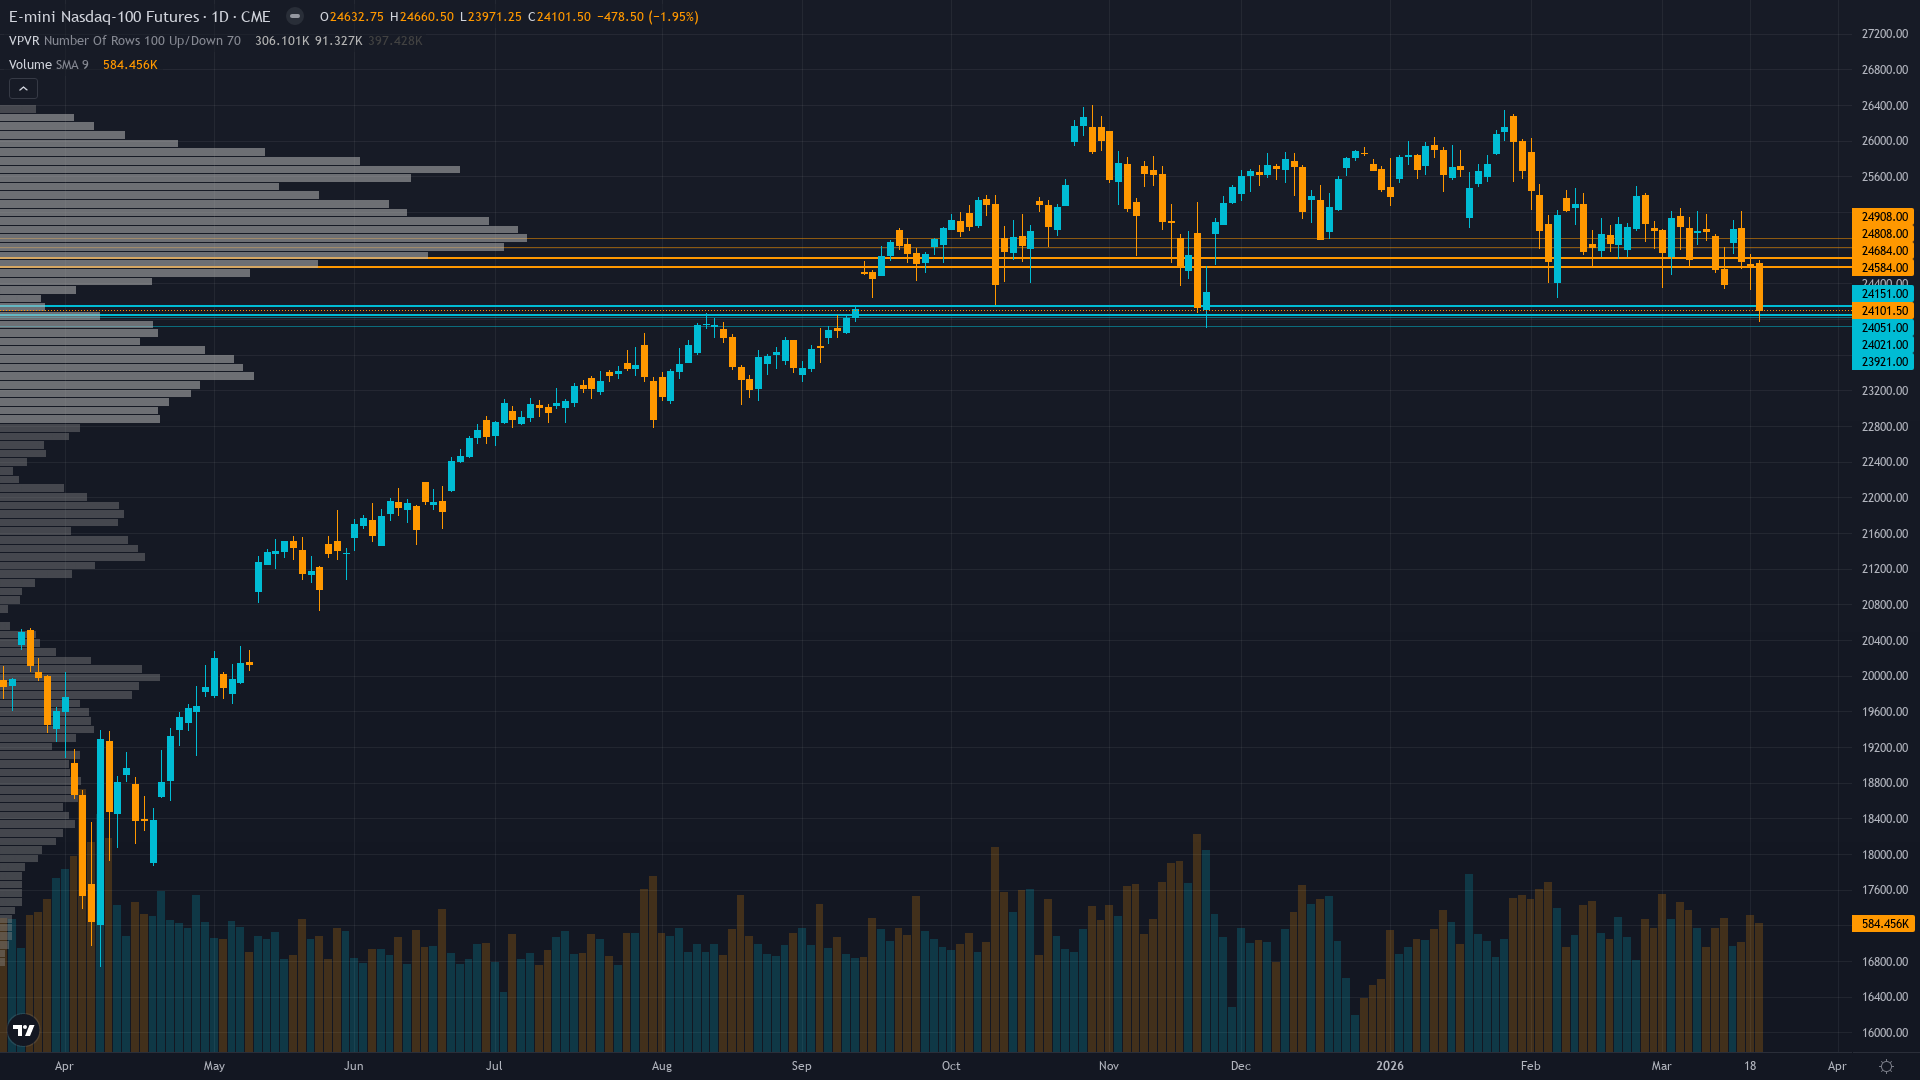
Trading at 24101.5 after a 1.95% slide, Nasdaq 100 faces sustained selling interest.
Moderately bearish with Asset Managers net short -27,334 contracts (-9% OI) and quarter-end 9 days away creating window dressing risk, but positioning not at extreme suggesting tactical caution rather than capitulation
Consensus vs MAD View
Market consensus: Defensive and fearful with 52% AAII bears expecting further downside, but institutional positioning moderately bearish rather than capitulating suggests tactical caution without full panic
Primary driver: Post-FOMC technical breakdown with NQ testing critical 0.786 Fibonacci support at 24,378 after March 18 hold at 3.5-3.75% eliminated dovish repricing hopes
Where the Crowd May Be Wrong
Desk identifies extreme sentiment capitulation (AAII 52% bears, -21.6% spread) as contrarian opportunity that market acknowledges but hasn't positioned for given persistent call bias (equity put/call 0.58) and moderate rather than extreme institutional bearishness, suggesting crowd sees the setup but lacks conviction to fade it; desk's NO CALL aligns with market's own tactical uncertainty creating low directional divergence despite recognition of sentiment extreme
Crowd Psychology
Neither side has committed heavily to Nasdaq 100 futures, leaving sentiment in a neutral zone that offers little directional guidance on its own.
Options Flow
VIX 26.78 elevated but equity put/call only 0.58 shows call bias persisting despite fear regime, while SPX put/call 1.26 indicates institutional index hedging - divergence suggests retail complacency beneath surface fear
The Bottom Line on Positioning
The positioning mosaic for tech futures combines fear sentiment with contracting volatility conditions. Trend strength is low at 3/10, indicating weak directional conviction and potential for range-bound behaviour. Taken together, institutional behaviour, crowd psychology, and derivatives data frame the setup heading into the new week.
This analysis covers one dimension. Our full weekly report combines six specialist agents into a single actionable briefing with directional bias, key levels, and risk-opportunity matrix.
Start Free — Get the Market of the WeekFree weekly report · No credit card · Upgrade anytime


