Nasdaq 100 COT & Institutional Positioning — Smart Money Analysis
Nasdaq 100 institutional positioning: COT data, sentiment analysis and smart money flow assessment.

Smart Money Positioning
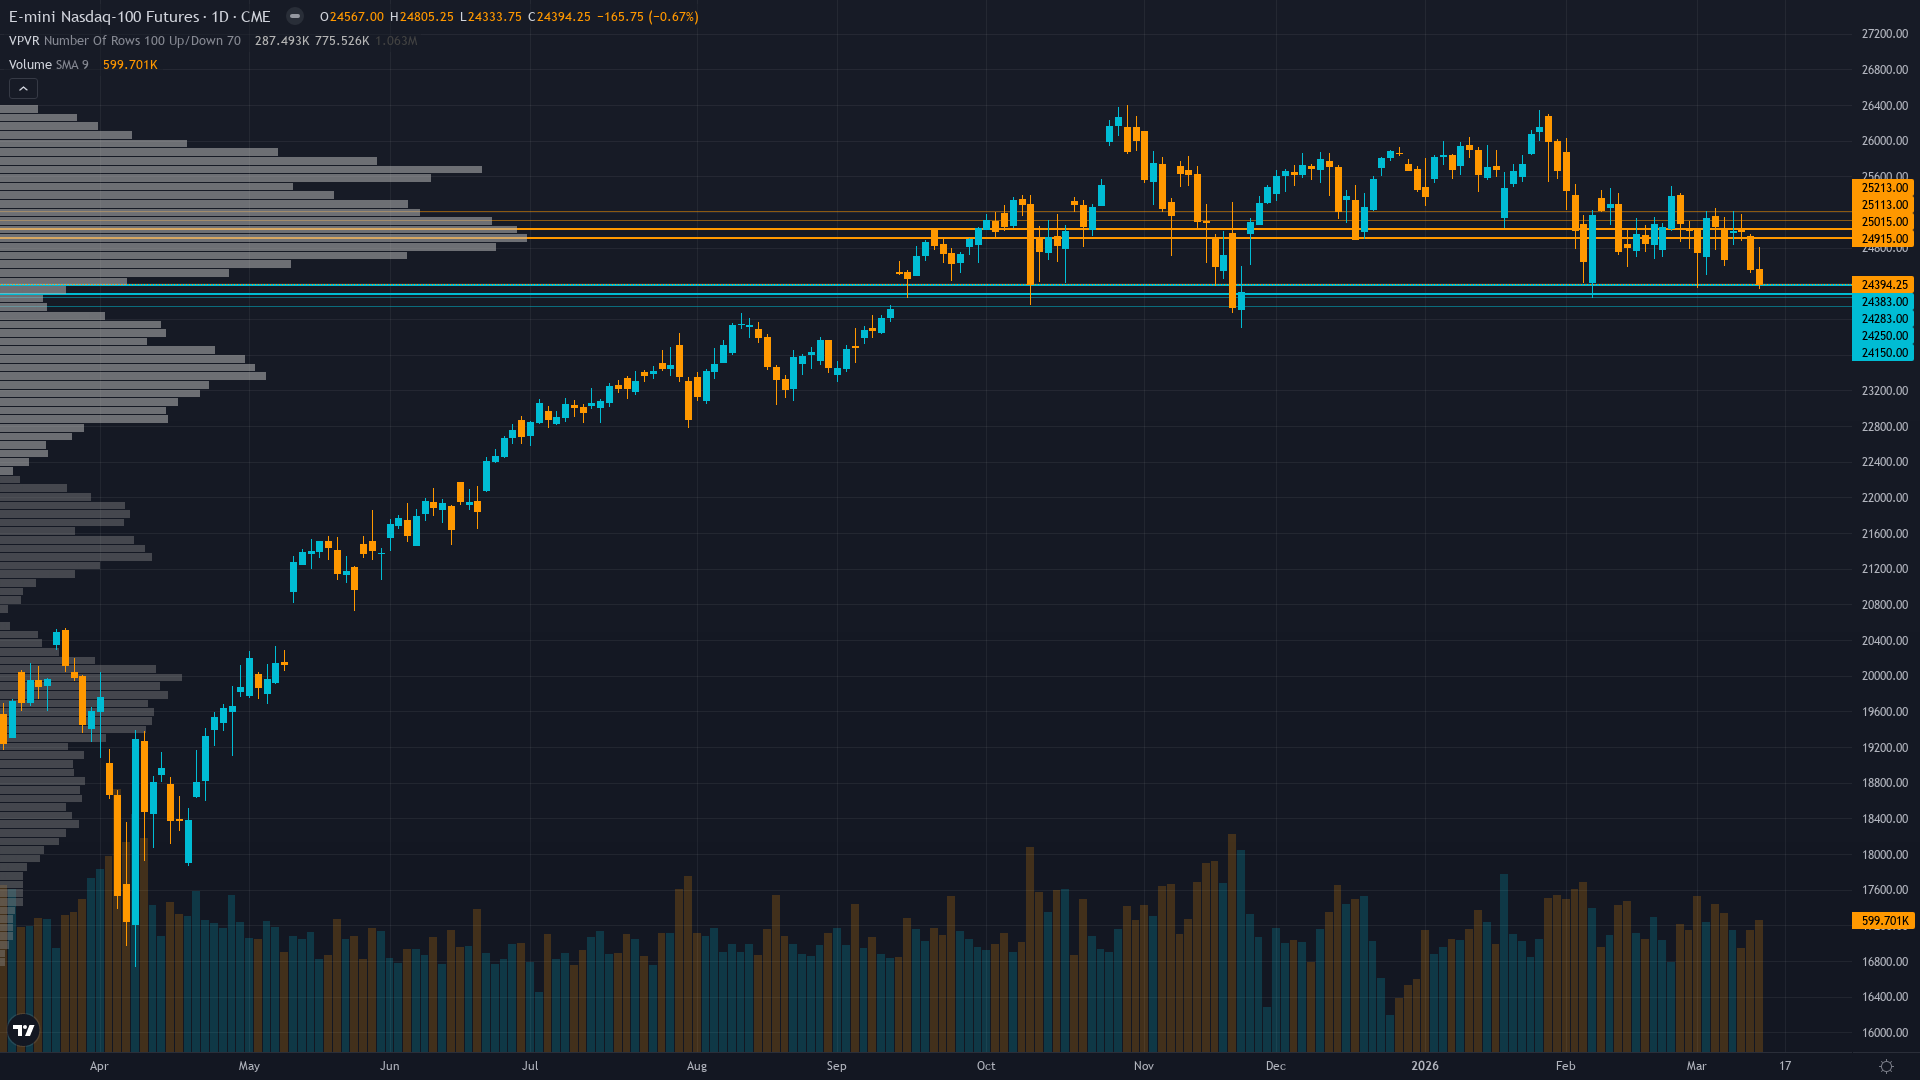
Nasdaq 100 holds at 24394.25, off 0.67% in a modest retracement from recent levels.
Contrarian bearish - specs net long 24,929 contracts building into weakness with 16 days to quarter-end (March 31) creating window dressing risk and forced liquidation potential
Consensus Check
Market consensus: Cautiously defensive awaiting March 18 FOMC clarity with extreme bearish sentiment acknowledged but technical deterioration and elevated volatility preventing aggressive positioning either direction
Primary driver: Extreme bearish sentiment (AAII 46.4% bearish vs 31.9% bullish) creating contrarian opportunity conflicting with elevated VIX at 27.18 and deteriorating technicals below both key moving averages ahead of March 18 FOMC meeting
Divergence Assessment
Desk identifies extreme sentiment capitulation (AAII -14.5% spread at historical reversal levels) creating contrarian opportunity, but consensus is divided rather than unified bearish, limiting directional divergence; desk's NO CALL aligns with market's own uncertainty ahead of March 18 FOMC binary catalyst, providing mild information edge on sentiment extreme significance but no strong positioning disagreement
Market Sentiment
The sentiment picture for Nasdaq 100 futures is evenly split, providing no contrarian signal in either direction. The next move will likely be event-driven.
What Options Markets Show
VIX spike to 25-27 range from 13.38 52-week low represents material fear regime shift; implied volatility at 29.87% elevated; mixed put/call signals (equity 0.68 vs SPX 1.16) suggest hedging rather than panic
Positioning Summary
Putting the positioning picture together for Nasdaq futures: sentiment is fear, trend strength at 4/10 paints a picture of a market with some direction but lacking strong conviction. The net assessment from institutional data, crowd positioning, and derivatives activity points to a market where the balance of forces tilts in a discernible direction.
This analysis covers one dimension. Our full weekly report combines six specialist agents into a single actionable briefing with directional bias, key levels, and risk-opportunity matrix.
Start Free — Get the Market of the WeekFree weekly report · No credit card · Upgrade anytime


