Gold Key Levels This Week — Support, Resistance & Confluence Zones
Gold key levels breakdown: support zones, resistance zones, confluence and price structure.

Price Architecture
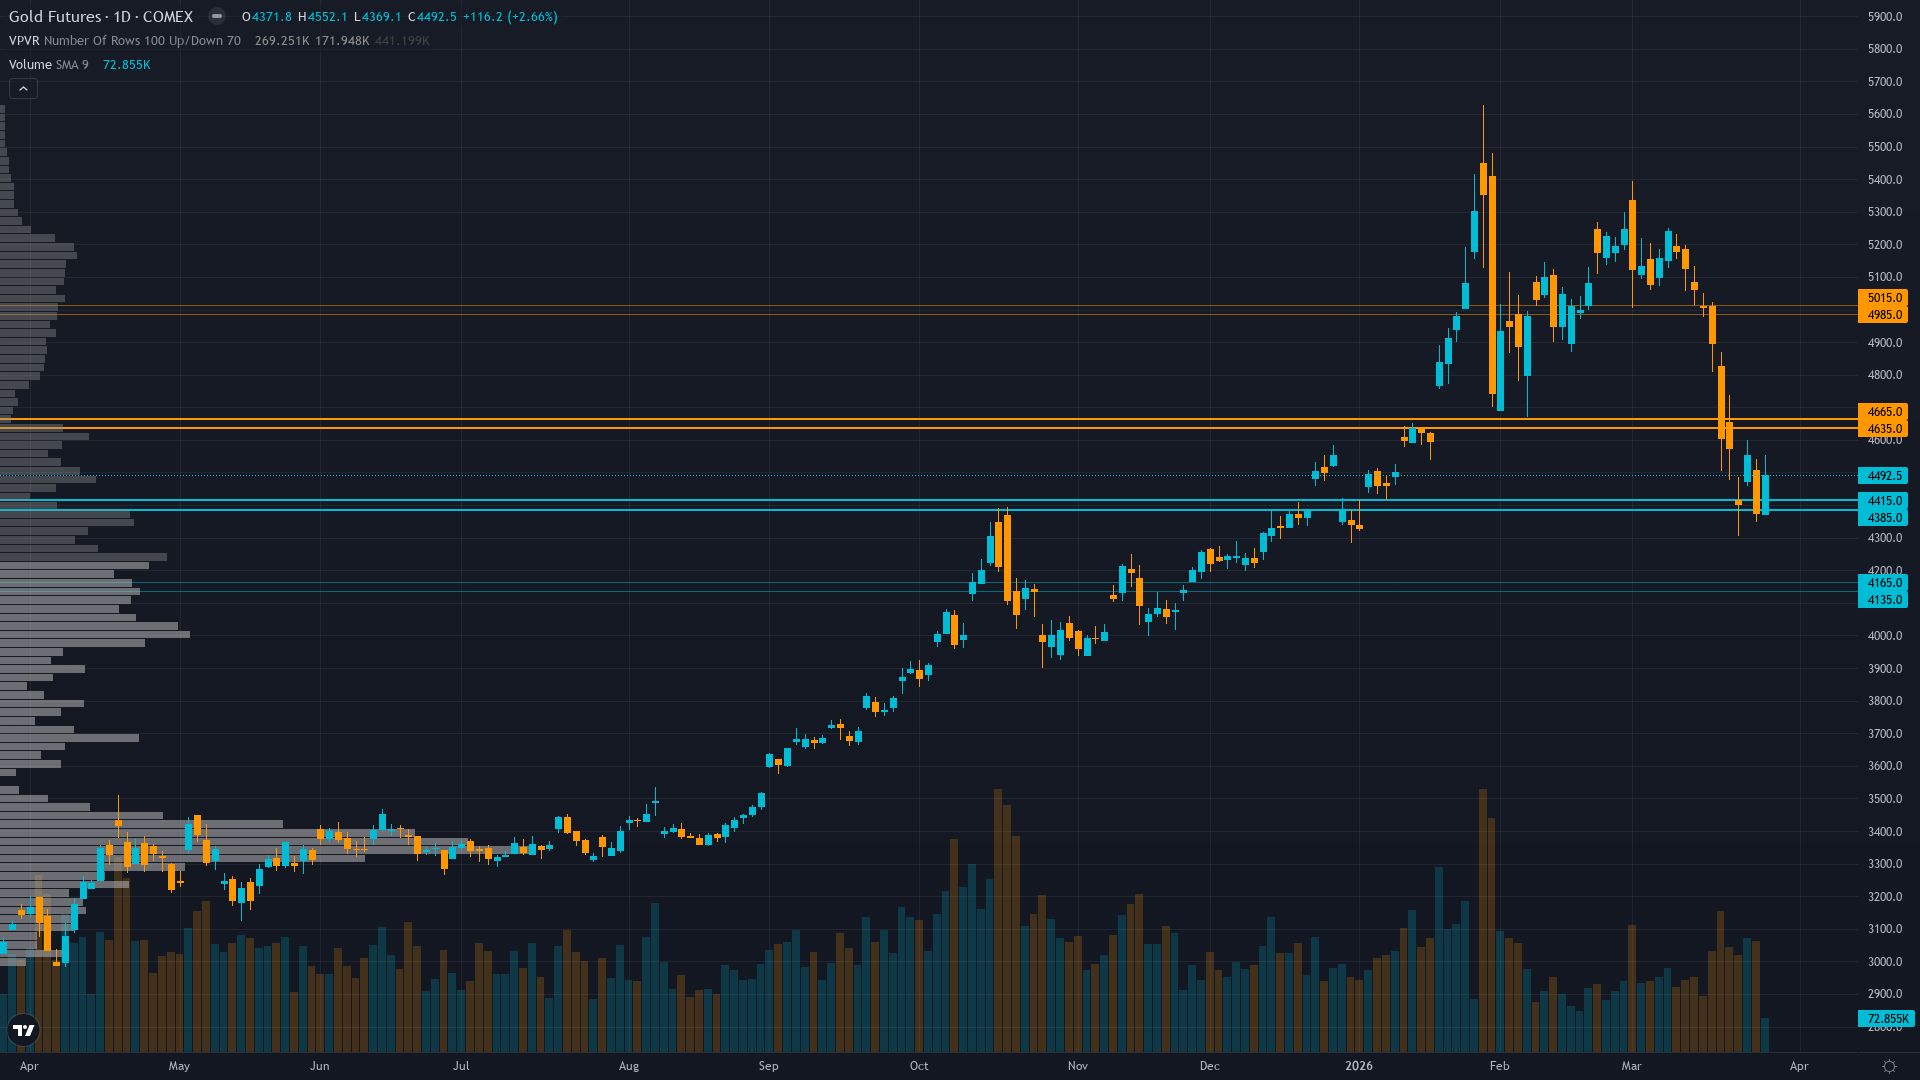
gold is trading at 4492.5, up 2.66% in the last 24 hours as buyers maintain control. The market in gold futures is coiling, with narrowing price ranges suggesting stored energy that will eventually release.
Daily downtrend intact with price at $4492 below 50-day MA at $4814 and 100-day MA near $4477 after breaking $5000 paradigm support mid-March, though 8% bounce from March 24 $4150 low shows potential stabilization attempt within broader bearish structure
Trend strength sits at 4/10, reflecting moderate directional pressure without clear dominance.
Downside Protection
The downside architecture for GC futures features support zones rooted in prior buying activity. These are not arbitrary lines but areas where real capital has previously been committed.
The reliability of support under breakdown attempting stabilization conditions is shaped by the interplay between volatility regime and historical volume at each level.
Resistance Zone Context
The upside path for gold price is marked by resistance zones where prior selling activity created structural barriers. Clearing these zones requires either strong momentum or a shift in the fundamental picture.
In the current market state, resistance zones remain key decision points.
Analytical Convergence
The most actionable levels for gold are those where multiple analytical disciplines converge. When technical structure, institutional positioning, and options flow all point to the same zone, the probability of price reacting there increases meaningfully.
Elevated volatility at 88th percentile requires wider stops with daily ranges potentially 3-6% versus normal 1.5-2%; current bounce from $4150 low suggests GVZ spike may be peaking but until vol normalizes below 70th percentile breakouts remain unreliable and false signals elevated
Our Multi-Agent Approach to Key Levels
The levels in our paid reports are generated by six specialist agents working in parallel. Technical analysis provides the structural framework, institutional data shows where capital is committed, options flow reveals hedging behaviour, fundamentals anchor levels to value, sentiment gauges crowd positioning, and economic analysis times the catalysts.
The output is a curated set of levels with institutional-grade validation — the kind of multi-dimensional analysis that hedge fund research desks produce, delivered at a fraction of the cost.
Our paid reports include specific support and resistance levels identified by six specialist agents — technical structure, institutional positioning, options flow, fundamentals, sentiment, and economic analysis. Not just lines on a chart, but zones validated by multi-discipline confluence.
Start Free — Get the Market of the WeekFree weekly report · No credit card · Upgrade anytime


