Gold Forecast This Week — Outlook, Drivers & Key Levels
This week's Gold outlook: key drivers, volatility context, risk-opportunity assessment and the week ahead.

Market Overview
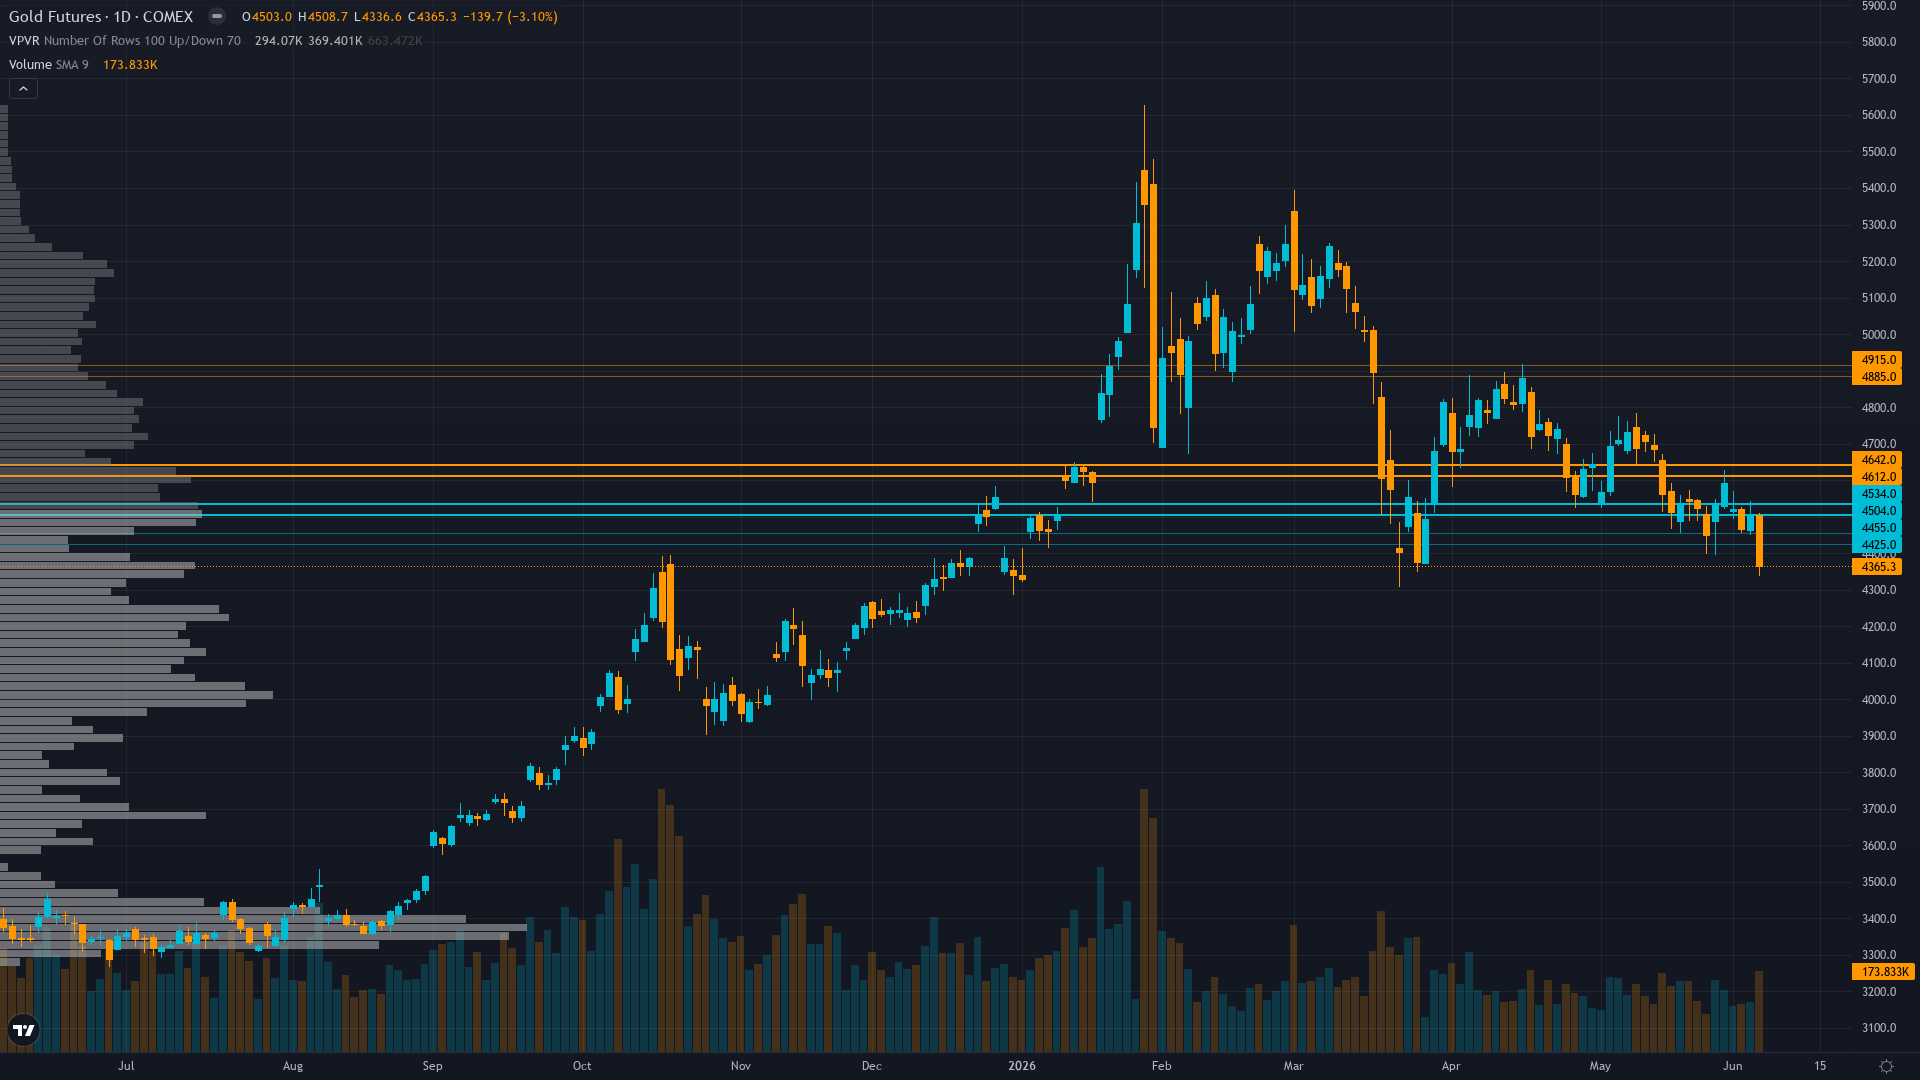
gold is trading at 4365.3, down 3.10% as selling pressure weighs on price. gold futures is in a breaking down market state, requiring careful assessment of current conditions.
Mixed with institutional year-end targets remaining at $5,000-5,400 maintaining structural bull case but near-term positioning increasingly defensive following 6 consecutive weeks of analytical failures and Friday NFP-driven breakdown to 2026 lows creating elevated tactical caution
This Week's Catalysts & Drivers
Primary driver: Mandatory miss reset protocol engaged after 6 consecutive failed directional calls exceeding 4-miss threshold while gold breaks below critical $4,370 support following June 6 NFP jobs report intensifying inflation concerns and eliminating rate cut expectations
Secondary factor: Technical breakdown accelerating with price at $4,365 decisively violating 200-day MA at $4,438 and 50-day MA at $4,637, RSI 42 showing no bullish divergence as daily downtrend structure confirms bearish momentum continuation toward $4,300 zone
Additional influence: Conflicting fundamental signals create analytical uncertainty as Q1 central bank demand held at 244 tonnes validating structural bid floor but managed money positioning surged 14.9% weekly to 111,341 contracts creating crowding risk if support fails decisively
Economic backdrop: Fed on hold at 4.25-4.50% with June 16-17 FOMC priced 99% no change, June 6 NFP jobs report stronger-than-expected intensifying inflation concerns and validating higher-for-longer trajectory, VIX 21.51 elevated above 20 threshold, DXY strength persists creating dual headwind
Fundamental assessment: Moderately undervalued at $4,365 versus JPMorgan $5,055 target but elevated real yields 2.16% and Fed higher-for-longer stance create persistent cyclical headwind offsetting Q1 central bank demand 244t structural support
Technical Picture
Breaking down through 200-day MA at $4,438 with price at $4,365 extending 22% decline from January $5,626 peak, RSI 42 neutral without bullish divergence, next major support $4,300 then $4,150 March low
At 3/10, trend strength is subdued, suggesting the market lacks a clear directional mandate.
Bull & Bear Case
Primary risk: Continued breakdown below $4,300 psychological support validates May CPI hot print scenario driving gold toward $4,150 March low or potentially $4,000 round number representing additional 5-8% downside from current levels as positioning liquidation accelerates (Probability: medium)
Primary opportunity: Fed June 16-17 FOMC introduces dovish optionality or May CPI softer-than-expected triggers dollar reversal and speculative short covering from current positioning extreme supporting bounce toward $4,500-4,600 resistance within 2-3 weeks (Timeframe: Next 2-3 weeks through June 11 CPI and June 16-17 FOMC as market digests whether breakdown represents washout low requiring positioning reset or continuation toward $4,000-4,150 zone)
This week's edge: Resetting after 6 consecutive misses per Rule 5 — thesis under mandatory review. Market remains divided between structural bull case (Q1 central bank demand 244t, institutional targets $5,000+) and cyclical breakdown (Fed higher-for-longer, NFP hot, real yields 2.16%). Desk lacks clear informational edge in current environment and requires fresh catalyst clarity before resuming directional calls.
Volatility Regime
Volatility for gold price sits at the 82th percentile over 90 days — an elevated regime that demands wider risk parameters and faster decision-making. The vol trend is down, with contraction across timeframes creating the kind of coiled conditions that historically resolve explosively.
Elevated volatility at 82nd percentile requires wider stops with daily ranges potentially 2.5-3.5% versus normal 1.5-2.0%; current $4,300-4,500 breakdown zone suggests breakouts become more reliable once volatility normalizes below 70th percentile post-June FOMC, but until then price action subject to elevated noise and false signal risk creating unfavorable environment for directional conviction
What to Watch
The May 2026 CPI release critical for validating whether inflation persistence requires extended Fed pause or allows eventual easing resumption, with hot print extending pressure while softer data could trigger relief rally on Thursday 11 June stands as the week's primary risk event — high-impact and capable of overriding the existing technical and sentiment setup.
The interplay between breaking down market conditions and upcoming catalysts will define this week's trading landscape for COMEX gold.
This analysis covers one dimension. Our full weekly report combines six specialist agents into a single actionable briefing with directional bias, key levels, and risk-opportunity matrix.
Start Free — Get the Market of the WeekFree weekly report · No credit card · Upgrade anytime


