Gold Forecast This Week — Outlook, Drivers & Key Levels
This week's Gold outlook: key drivers, volatility context, risk-opportunity assessment and the week ahead.

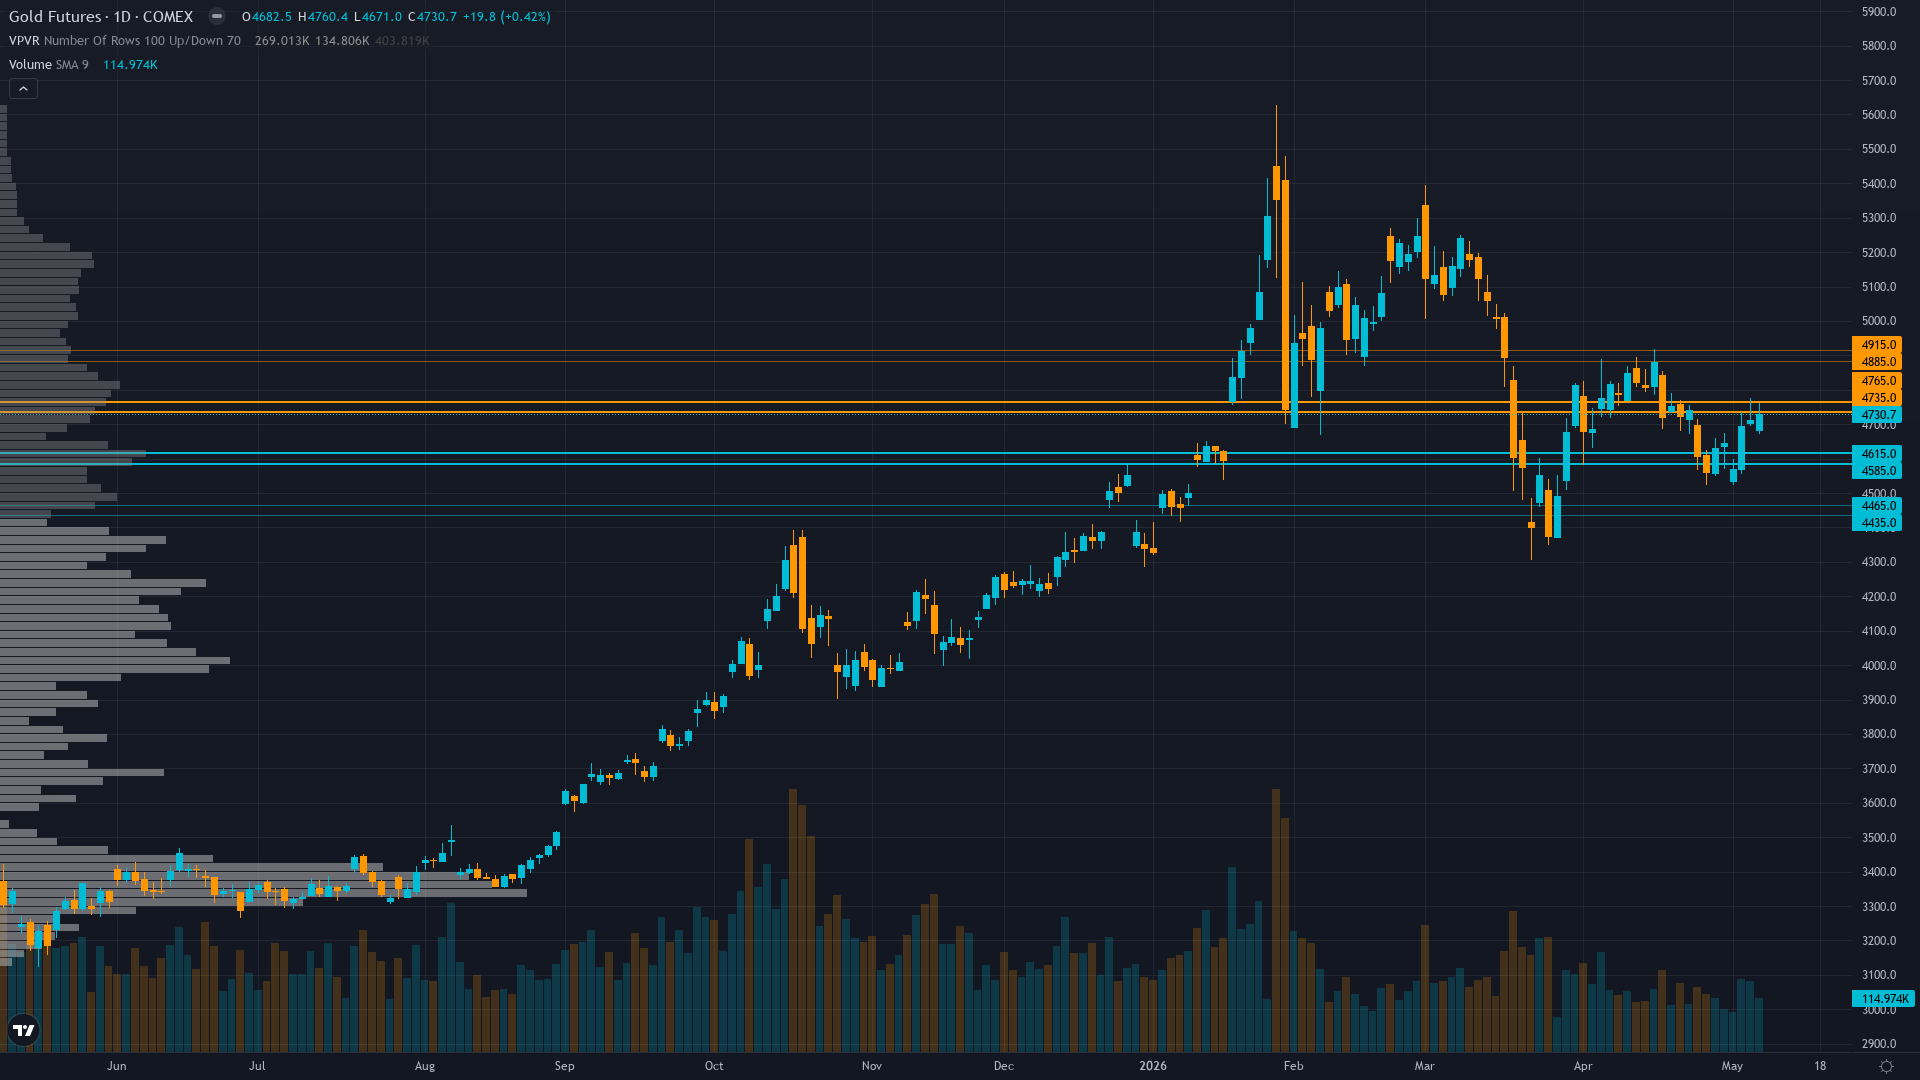
This Week's Starting Point
At 4728, gold has inched 0.63% higher in a measured advance. Price action in gold futures has compressed into a consolidation pattern, typically a precursor to a directional breakout.
Mixed with institutional year-end targets at $5,000-5,600 maintaining structural bull case but near-term uncertainty elevated ahead of May 12 April CPI release creating tactical caution despite positioning extremes
Forces in Play
Primary driver: Managed Money net long positioning collapsed to RECORD LOW levels as of May 6 creating extreme contrarian setup with speculative capitulation at sub-15th percentile while central bank Q1 demand held firm at 244 tonnes validating structural bid floor
Secondary factor: Gold at $4,728 consolidating 16% below January $5,595 all-time high in fair value zone versus institutional targets of $5,000-5,600 as April CPI release May 12 (2 days away) represents critical binary catalyst for Fed rate trajectory
Additional influence: Technical structure stabilizing with price above 50-day MA at $4,650 and RSI 61 showing mild bullish momentum while real yields elevated at ~1% create cyclical headwind offset by Western ETF positioning flush creating tactical opportunity
Economic backdrop: Fed held April 29 at 3.50-3.75% (11 days ago) with June FOMC priced 97% no change, March CPI 3.3% YoY spike 6 weeks ago drove correction, April CPI release May 12 critical catalyst, real yields ~1% creating opportunity cost for gold
Fundamental assessment: Fair value at $4,728 versus institutional targets $4,746-5,600, Q1 supply +2% to 1,231t with demand bifurcated between robust central bank buying (244t Q1) and weak Western ETF flows due to elevated real yields creating cyclical headwind to structural support
Technical Landscape
Consolidating at $4,728 in $4,600-4,900 range, price above 50-day MA ~$4,650 and well above 200-day MA ~$4,200, RSI 61 rising with room to run, resistance $4,890 immediate/$5,000 major, support $4,630/$4,500
Trend strength registers at 6/10, suggesting meaningful but not extreme directional bias.
Risk-Reward Assessment
Primary risk: April CPI printing hot again validates Fed higher-for-longer stance driving dollar strength above DXY 100 and sustaining elevated real yields, triggering further managed money short positioning and pushing gold toward $4,500-4,300 major support representing 4-7% additional downside (Probability: medium)
Primary opportunity: April CPI softer than expected triggers Fed dovish pivot expectations at June FOMC, dollar reversal from current DXY 98.2 level, and short covering cascade from record-low speculative positioning driving rally toward $4,900-5,000 resistance within 2-3 weeks (Timeframe: Next 2-4 weeks through May 12 CPI release, June 17 FOMC, and into early July as market assesses whether speculative capitulation represents washout low and positioning extreme mean reverts)
This week's edge: Market appears to underestimate significance of Managed Money positioning collapse to RECORD LOWS as of May 6 creating sub-15th percentile extreme that historically precedes mean reversion rallies, while widely-discussed Q1 central bank demand holding at 244t (+3% YoY) validates structural floor is intact versus January collapse fears; desk recognizes positioning flush creates asymmetric short-covering potential if April CPI allows any dovish Fed pivot narrative while consensus remains focused on higher-for-longer structural headwind
Risk Environment
With vol at the 72th percentile, gold price is trading in an elevated regime where daily ranges can surprise even experienced traders. Volatility is contracting, with realised vol declining across timeframes. Compressed volatility often precedes sharp directional moves as energy builds.
Elevated volatility at 72nd percentile requires wider stops with daily ranges potentially 2.0-3.0% versus normal 1.5-2.0%; current $4,600-4,900 consolidation zone suggests breakouts become more reliable once volatility normalizes below 65th percentile by late May, but April CPI binary event risk maintains elevated noise through mid-May
Looking Forward
All eyes turn to April 2026 CPI release critical for validating whether March 3.3% inflation spike was transitory or trend requiring Fed higher-for-longer stance, with hot print extending pressure while soft data could trigger relief rally on Tuesday 12 May, which carries enough weight to force a decisive directional move.
The week ahead for gold futures hinges on whether the prevailing consolidating regime can absorb the scheduled catalysts without a regime shift.
This analysis covers one dimension. Our full weekly report combines six specialist agents into a single actionable briefing with directional bias, key levels, and risk-opportunity matrix.
Start Free — Get the Market of the WeekFree weekly report · No credit card · Upgrade anytime


