Gold Forecast This Week — Outlook, Drivers & Key Levels
This week's Gold outlook: key drivers, volatility context, risk-opportunity assessment and the week ahead.

This Week's Starting Point
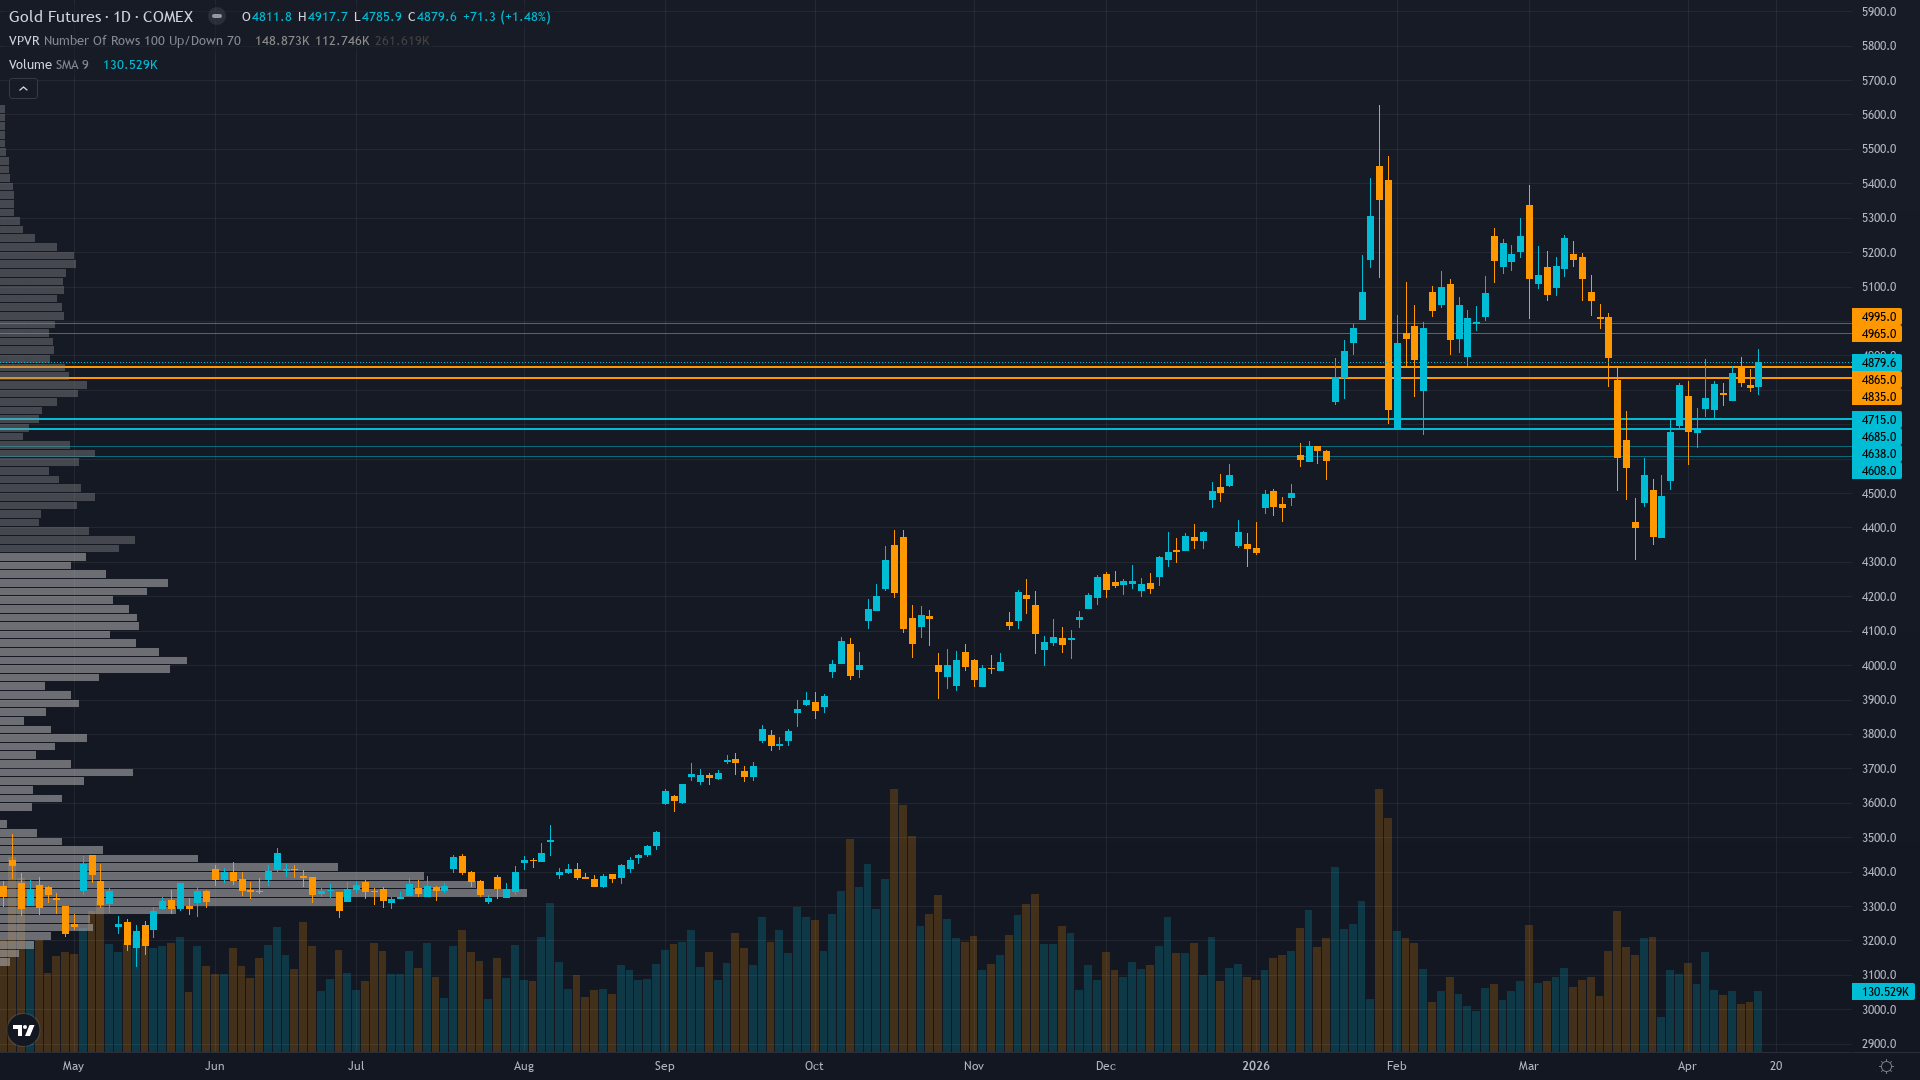
Trading at 4879.6 after a 1.48% move higher, gold continues to attract buying interest. Price action in gold futures has compressed into a consolidation pattern, typically a precursor to a directional breakout.
Mixed with institutional price targets remaining at $5,000-5,400 (Goldman Sachs, JP Morgan) but near-term uncertainty elevated following March correction and geopolitical headline risk from US-Iran tensions creating tactical volatility
Forces in Play
Primary driver: Gold consolidating at $4,879 following bounce from April 12-13 lows near $4,658 as US-Iran negotiations remain unresolved and Middle East tensions continue providing safe-haven bid, offsetting persistent dollar strength at DXY 98.2 and elevated real yields
Secondary factor: Central bank demand stabilized at 27 tonnes in February 2026 after January's 5-tonne collapse, restoring to 2025 monthly average and validating structural bid floor at $4,700-4,800 levels despite slower momentum than exceptional 2025 pace
Additional influence: Technical structure showing early stabilization with price recovering 4.7% from April 13 low of $4,658, testing resistance near $4,900 50-day MA zone while RSI at neutral 51 indicates neither overbought nor oversold conditions in post-correction consolidation phase
Economic backdrop: Fed held March 18-19 at 3.5-3.75% with hawkish dot plot revision to one 2026 cut, DXY at 98.2 down 1.2% past week but stabilized from oversold levels, VIX at 18.24 below 20 threshold indicating normalized equity conditions, next FOMC May 6-7
Fundamental assessment: Modestly undervalued at $4,879 versus institutional targets of $5,000-5,400 from Goldman Sachs and JP Morgan, structural support from central bank demand intact at 585t quarterly forecast though March CPI spike to 3.3% YoY creates higher-for-longer Fed trajectory headwind
Technical Landscape
Consolidating at $4,879 in $4,700-4,900 range following 8% bounce from April 13 low, price below 50-day MA at $4,980 but well above 200-day MA at $4,174, RSI neutral at 51, momentum directionless as market digests post-FOMC correction
Trend strength registers at 6/10, suggesting meaningful but not extreme directional bias.
Risk-Reward Assessment
Primary risk: Continued dollar strength above DXY 100 combined with April CPI (due around May 13) printing hot again validates Fed higher-for-longer stance and drives gold toward $4,450-4,600 support zone representing additional 6-8% downside from current levels (Probability: medium)
Primary opportunity: Resolution or de-escalation of US-Iran tensions removes geopolitical premium while Fed maintains dovish optionality at May 6-7 meeting, triggering tactical profit-taking toward $4,600-4,700 before resuming rally toward $5,000-5,200 on structural central bank demand (Timeframe: Next 3-4 weeks through May 6-7 FOMC and into mid-May as market digests whether April consolidation represents base-building for recovery or distribution before renewed decline)
This week's edge: Market may be underestimating significance of February central bank demand recovery to 27 tonnes after widely-discussed January collapse, suggesting structural bid has stabilized rather than permanently broken; fresh $550M ETF inflows demonstrate institutional conviction during weakness that retail sentiment shows crowd has not capitulated from, creating potential for squeeze higher if May FOMC maintains dovish optionality
Risk Environment
With vol at the 78th percentile, gold price is trading in an elevated regime where daily ranges can surprise even experienced traders. Volatility is contracting, with realised vol declining across timeframes. Compressed volatility often precedes sharp directional moves as energy builds.
Elevated volatility at 78th percentile requires wider stops with daily ranges potentially 2.5-3.5% versus normal 1.5-2%; current $4,700-4,900 consolidation zone suggests breakouts become more reliable once volatility normalizes below 70th percentile by late April
Looking Forward
All eyes turn to Federal Reserve FOMC Meeting decision with markets pricing 85% probability of hold at 3.5-3.75% range, forward guidance critical for assessing whether March CPI spike was transitory or requires extended pause in easing cycle on Wednesday 6 May, which carries enough weight to force a decisive directional move.
The week ahead for gold futures hinges on whether the prevailing consolidating regime can absorb the scheduled catalysts without a regime shift.
This analysis covers one dimension. Our full weekly report combines six specialist agents into a single actionable briefing with directional bias, key levels, and risk-opportunity matrix.
Start Free — Get the Market of the WeekFree weekly report · No credit card · Upgrade anytime


