Gold Forecast This Week — Outlook, Drivers & Key Levels
This week's Gold outlook: key drivers, volatility context, risk-opportunity assessment and the week ahead.

Market Overview
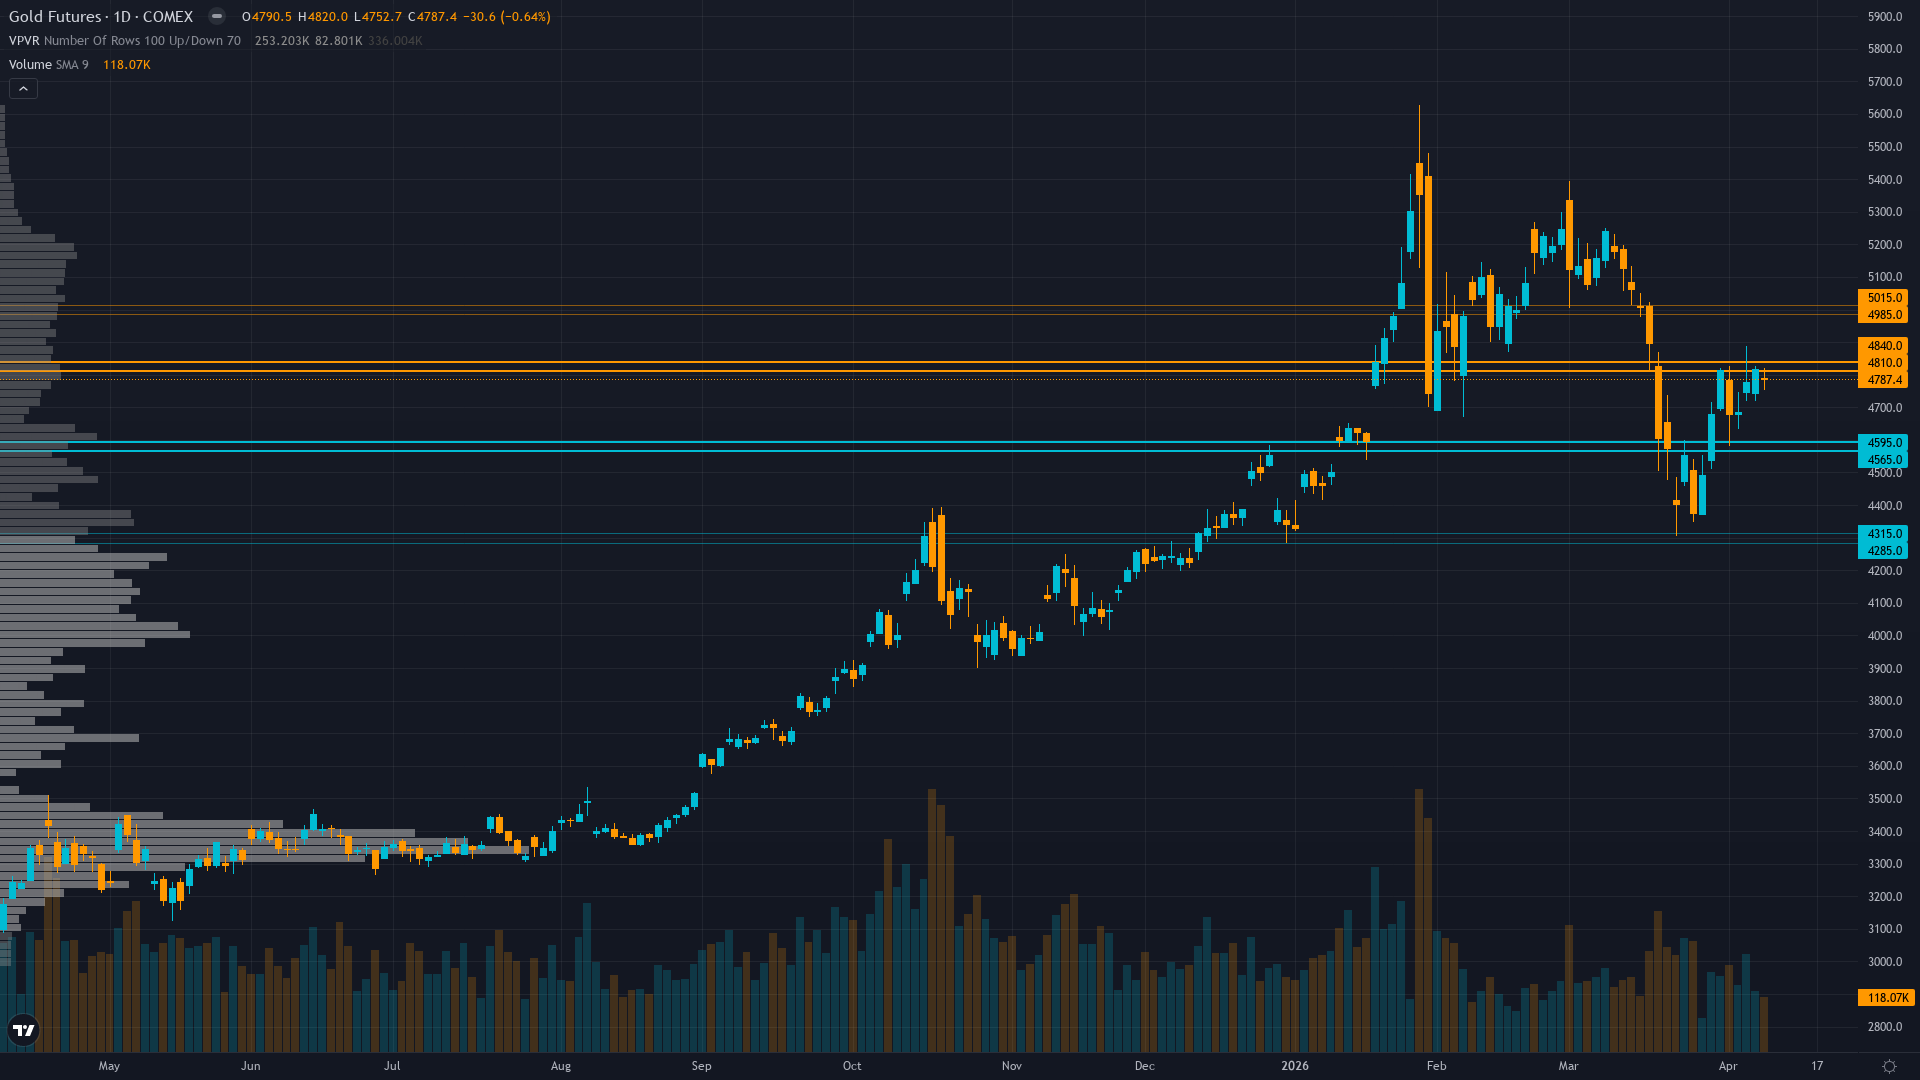
Trading at 4787 with a 0.18% uptick, gold is drifting higher without strong conviction. gold futures is range-bound and tightening, with decreasing volatility signalling a directional resolution ahead.
Mixed with institutional price targets remaining at $5000-5400 (Goldman Sachs, UBS, JP Morgan) but near-term uncertainty elevated following March CPI spike eliminating Fed rate cut expectations and dollar strength above DXY 100
This Week's Catalysts & Drivers
Primary driver: Gold consolidating at $4787 in post-correction stabilization mode following March CPI shock that spiked inflation to 3.3% YoY (0.9% MoM), creating conflicting signals between fresh institutional ETF inflows ($511M and $550M in early April) and persistent macro headwinds from rising real yields and DXY strength above 100
Secondary factor: Central bank demand rebounded to 27 tonnes in February (released April 6) after January's 5-tonne collapse, returning to the 26-27t monthly 2025 average and partially validating structural bid thesis, though momentum clearly decelerated from prior year's exceptional pace
Additional influence: Technical structure remains damaged with daily downtrend intact, price below broken 50-day MA (~$4666) after violating triangle support on April 7, though bounce from $4657 April 7 low suggests potential exhaustion of panic selling phase at current $4750-4800 zone
Economic backdrop: Fed held March 18-19 at 3.5-3.75% with hawkish dot plot revision to one 2026 cut, then March CPI on April 10 printed 3.3% YoY (0.9% MoM largest monthly jump in over a year) eliminating near-term rate cut probability while DXY rebounded to 100+ from oversold levels
Fundamental assessment: Modestly undervalued at $4787 versus institutional targets of $5000-5400 (Goldman Sachs, UBS, JP Morgan), but March CPI spike to 3.3% YoY has shifted Fed trajectory toward higher-for-longer stance creating rising real yields above 1% as primary structural headwind offsetting still-constructive central bank demand
Technical Picture
Daily downtrend from $5626 January peak with price at $4787 now testing resistance near $4800-4850 zone after breaking below 50-day MA on April 7, next major support at $4623 (S2 level) with RSI at 56 showing neutral momentum and no clear directional conviction
At 5/10, trend strength is middling — enough to suggest a lean, but not enough to trade with high confidence.
Bull & Bear Case
Primary risk: Further dollar strength above DXY 100 combined with April CPI (due around May 13) printing hot again validates Fed higher-for-longer stance and drives gold toward $4623-4450 support zone representing 3-7% additional downside from current levels (Probability: medium)
Primary opportunity: Fed maintains dovish optionality at May 6-7 meeting suggesting March CPI spike was transitory, triggering dollar reversal from current DXY 100+ rebound and supporting gold rally back toward $4900-5000 resistance zone within 2-4 weeks (Timeframe: Next 2-4 weeks through May 6-7 FOMC and into mid-May as market digests whether March correction represents washout low or continuation of breakdown)
This week's edge: Market may be underestimating the significance of February central bank demand recovery to 27 tonnes (released April 6) versus the widely-discussed January collapse, suggesting structural bid has stabilized rather than permanently broken, while fresh $1B+ in ETF inflows demonstrates institutional conviction during weakness that retail sentiment data shows crowd has not capitulated from; however, timing of bullish positioning requires confirmation that March CPI spike was transitory rather than trend reversal
Volatility Regime
Volatility for gold price sits at the 82th percentile over 90 days — an elevated regime that demands wider risk parameters and faster decision-making. The vol trend is down, with contraction across timeframes creating the kind of coiled conditions that historically resolve explosively.
Elevated volatility at 82nd percentile requires wider stops with daily ranges potentially 2.5-3.5% versus normal 1.5-2%; current $4700-4850 consolidation zone suggests breakouts become more reliable once volatility normalizes below 70th percentile by late April, but until then false signals remain elevated
What to Watch
The Federal Reserve FOMC Meeting decision with markets pricing 85% probability of hold at current 3.5-3.75% range, forward guidance critical for assessing whether March CPI spike was transitory or represents trend reversal requiring extended pause on Wednesday 6 May stands as the week's primary risk event — high-impact and capable of overriding the existing technical and sentiment setup.
The interplay between consolidating market conditions and upcoming catalysts will define this week's trading landscape for COMEX gold.
This analysis covers one dimension. Our full weekly report combines six specialist agents into a single actionable briefing with directional bias, key levels, and risk-opportunity matrix.
Start Free — Get the Market of the WeekFree weekly report · No credit card · Upgrade anytime


